. 2009 Apr 13;206(4):877-92.
doi: 10.1084/jem.20082900. Epub 2009 Apr 6.

Control of T helper cell differentiation through cytokine receptor inclusion in the immunological synapse

Affiliations

Control of T helper cell differentiation through cytokine receptor inclusion in the immunological synapse

Roberto A Maldonado et al. J Exp Med. .

Abstract

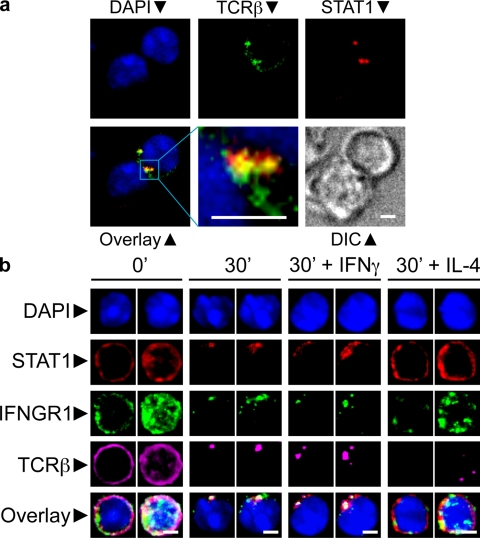
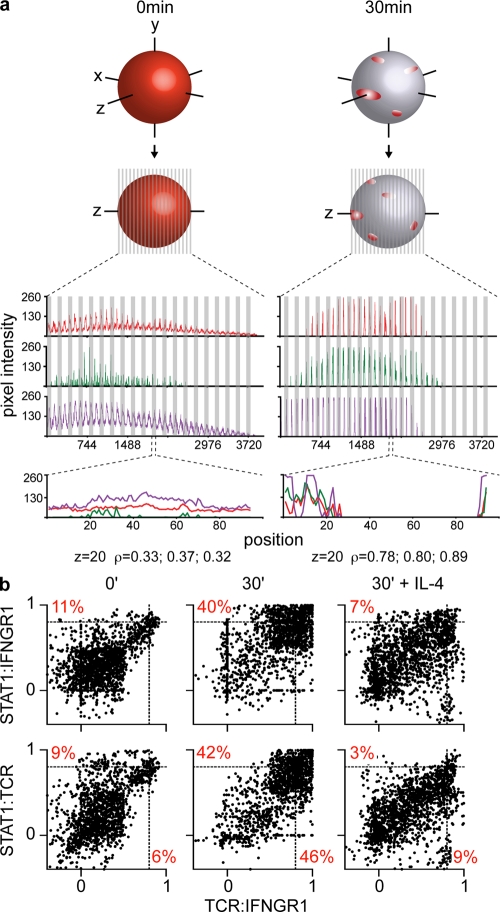
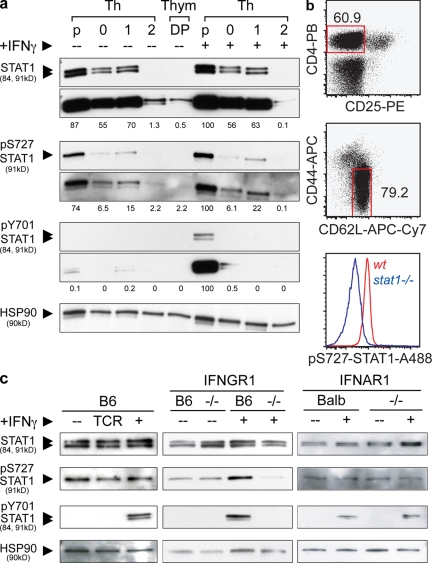
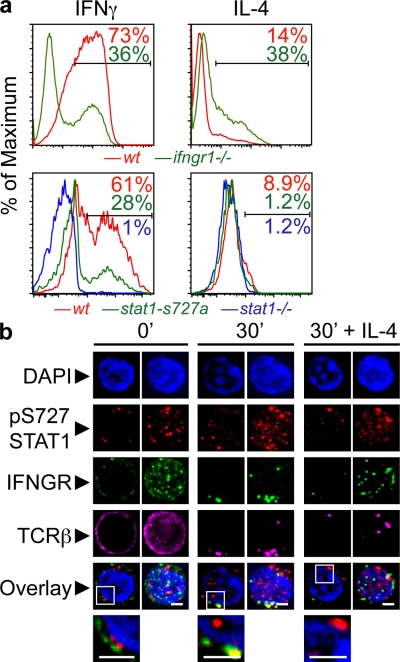
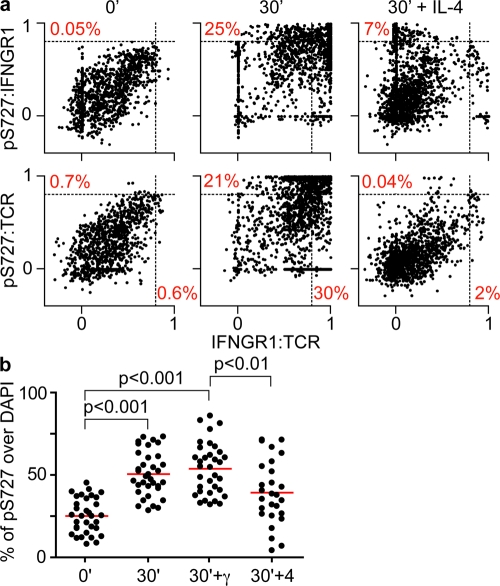
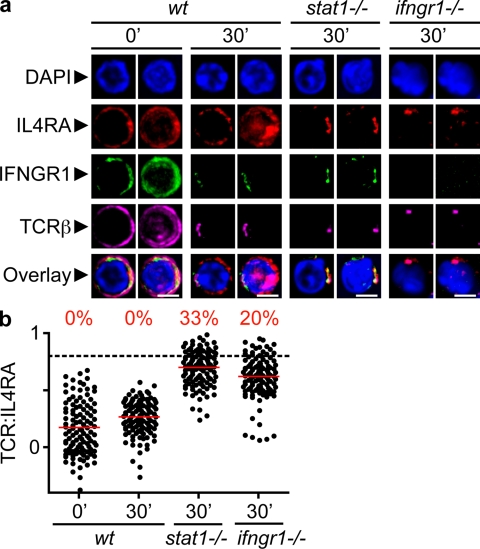
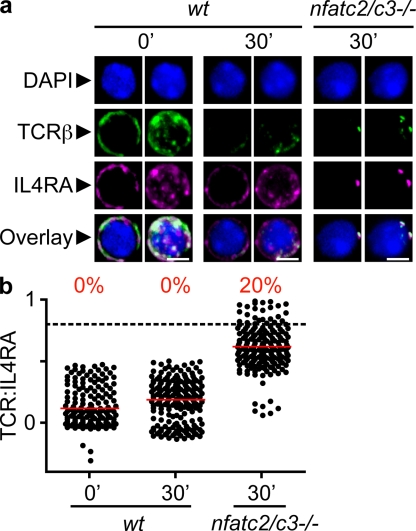
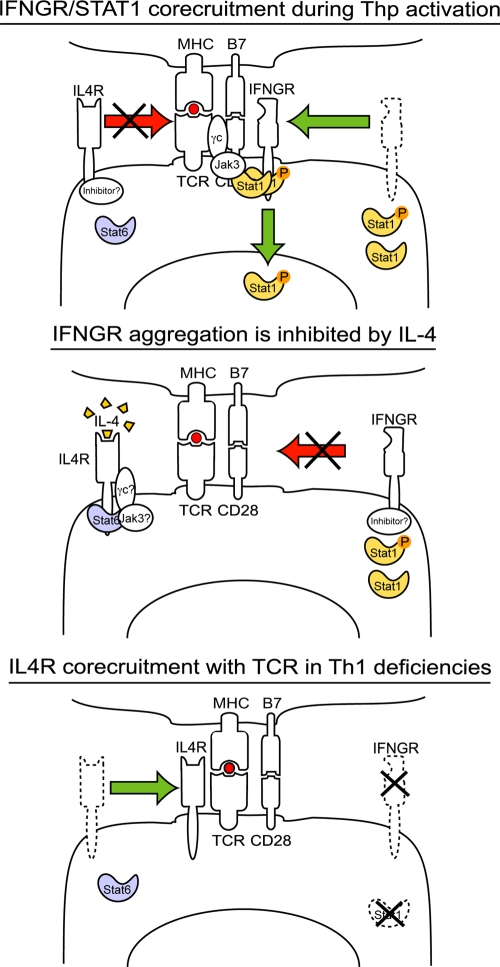
The antigen recognition interface formed by T helper precursors (Thps) and antigen-presenting cells (APCs), called the immunological synapse (IS), includes receptors and signaling molecules necessary for Thp activation and differentiation. We have recently shown that recruitment of the interferon-gamma receptor (IFNGR) into the IS correlates with the capacity of Thps to differentiate into Th1 effector cells, an event regulated by signaling through the functionally opposing receptor to interleukin-4 (IL4R). Here, we show that, similar to IFN-gamma ligation, TCR stimuli induce the translocation of signal transducer and activator of transcription 1 (STAT1) to IFNGR1-rich regions of the membrane. Unexpectedly, STAT1 is preferentially expressed, is constitutively serine (727) phosphorylated in Thp, and is recruited to the IS and the nucleus upon TCR signaling. IL4R engagement controls this process by interfering with both STAT1 recruitment and nuclear translocation. We also show that in cells with deficient Th1 or constitutive Th2 differentiation, the IL4R is recruited to the IS. This observation suggest that the IL4R is retained outside the IS, similar to the exclusion of IFNGR from the IS during IL4R signaling. This study provides new mechanistic cues for the regulation of lineage commitment by mutual immobilization of functionally antagonistic membrane receptors.


Figures

Figure 1.
Figure 1.
Corecruitment of TCR, IFNGR1, and STAT1 to the IS. (a) Thps were purified from the LNs of young animals by magnetic negative separation using antibody-coupled microbeads and the MACS system, followed by FACS sorting of CD4+CD62highCD25-CD44low cells. These Thps from OTII transgenic mice were mixed with OVA peptide-pulsed DCs, fixed, stained, and imaged for the markers indicated. Shown are pictures of two independent experiments. (b) Sorted Thps were stained and activated by TCR cross-linking with a combination of anti-TCRβ (APC) and goat anti-hamster antibodies (Alexa-647). When indicated, 20ng/ml of recombinant mouse IFN-γ or IL-4 was added to the culture. Cells were fixed and stained with monoclonal antibodies directed against the indicated molecules. For every condition indicated, left images represent the middle optical z section of the cell, and the right image represents the maximum projection for all the z sections of that cell. Images in the figures were processed to exclude out-of-focus pixels with the nearest neighbors deconvolution method. Shown are pictures of four independent experiments. Bars, 3 µm.
Figure 2.
Figure 2.
Quantification of TCR, IFNGR1, and STAT1 corecruitment. (a) Linearization of the cell membrane. Schematic representation of the redistribution of membrane receptors on the surface of Thps before and after activation (top). Regions around the cell surface were drawn and scanned using the Metamorph software to obtain the mean pixel intensities of the membrane-bound markers analyzed with their x, y coordinates in all z planes of every cell. Top histograms depict the totality of z sections of one cell where pixel intensities (y axis) were plotted according to their position in a concatenated fashion, with one z section per every 40–100 positions in the x axis. Bottom histograms represent the middle z section of the cell (z = 20) where pixel intensities were plotted according to their position in the region (x axis, 100 positions scanned). STAT1, red; IFNGR1, green; and TCR, purple. (b) Corecruitment analysis by whole cell linearization of the cell surface and correlation plots. In these correlation plots where every dot represents the value of correlation between the distributions of STAT1 and IFNGR1 (left) or STAT1 and TCR (right) in the y axis and TCR and IFNGR1 on the x axis in one z section of a particular cell. This analysis results from combination of four independent experiments.
Figure 3.
Figure 3.
Phosphorylation status of STAT1 during T cell development differentiation and activation. (a) STAT1 and phospho-STAT1 analysis on DP thymocytes, Thp, and Th cells. Cells were isolated from the thymus, spleen, and LNs of young animals. Thps were purified by magnetic bead negative selection and flow cytometry and activated using Th0 (0, with IL-2), Th1 (1, with IFN-γ, IL-2, and anti-IL4), and Th2 (2, with IL-4 and anti-IFN-γ) conditions. In parallel, DPs were sorted by flow cytometry as in Materials and methods. All cell types (except for DPs) were left untreated (–) or incubated with IFN-γ(+) for 30 min before cell lysis. Cells lysates were analyzed by Western blot, and two different time exposures of the blots are shown. The sizes of the corresponding fragments are indicated in parenthesis. Quantification was achieved by densitometric analysis of the blots. The values shown correspond to the percentage relative to the highest density normalized to each individual HSP90 control (see Materials and methods). Shown are blots representative of two independent experiments. (b) Intracellular staining of pS727-STAT1. LN cells were harvested, rapidly fixed, and permeabilized. Cells were labeled for the markers indicated and analyzed using flow cytometry. Shown are blots representative of four independent experiments. (c) STAT1 and phospho-STAT1 analysis on Thps. Thps were purified using the aforementioned method and incubated in complete medium and culture conditions in absence (–) or presence of TCR stimuli (TCR) or IFN-γ (+, 20 ng/ml). Shown are blots representative of three independent experiments.
Figure 4.
Figure 4.
Role of IFNGR and STAT1 during in vitro Th1 differentiation and pS727-STAT1 involvement in the IS. (a) CD4+CD62LhighCD25 Thps from wt or ifngr1−/− mice were purified by magnetic bead separation, followed by flow cytometric sorting. Plate-bound anti-CD3 and anti-CD28 were used to activate cells, and after 5 d in culture the production of cytokines was evaluated by ICS and flow cytometry. Shown are results representative of six independent experiments. (b) Cells were sorted by negative selection of CD4+ T cells, activated by cross-linking of their TCRs, fixed, and stained as indicated, and images were acquired and treated (deconvolution) as in Fig. 1 (of four experiments; n = 73–83). Bars, 2 µm.
Figure 5.
Figure 5.
Quantification of pS727-STAT1 localization. (a) Corecruitment assessment by whole-cell linearization method and correlation plots. As in Fig. 2, the distributions of the TCR, IFNGR1, and pS727-STAT1 (pS727) were obtained by scanning the content of regions created around the surface and subjacent to the plasma membrane of every cell (n = 73–83) for the calculation of ρ between the distribution of these markers. The correlation plots represent the pool of z sections (n = 1,980–2,490). (b) Translocation of pS727-STAT1 (pS727) to the nucleus. To obtain a numerical value representing the degree of superposition between pS727-STAT1 and DAPI stainings, a Metamorph built-in colocalization tool was applied to every cell by drawing regions that include the totality of each cell (membrane, cytoplasm, and nucleus). The results are expressed as the percentage of integrated surface of pS727-STAT1 that overlaps DAPI staining on a per cell basis (mean of all the z sections). The analysis herein combines observations of four independent experiments.
Figure 6.
Figure 6.
IL4R is recruited to the IS in the absence of IFNGR1 or STAT1. Thps were isolated by negative magnetic separation from the LNs of young animals of different genetic backgrounds (B6, ifngr1−/−, 129, and stat1−/−). CD4+CD62Lhigh T cells (98% pure) were activated, fixed, and stained as indicated, and then imaged as described in Fig. 1. (a) Confocal images. Bars, 4 µm. (b) Quantification by linearization of whole-cell surface. Four independent experiments were analyzed, and the mean of ρ was calculated for each cell (n = 88–114), as in Fig. 2.
Figure 7.
Figure 7.
IL4R is recruited to the IS in the absence of NFATc2 and NFATc3. Thps were isolated prepared as in Fig. 1 from the LNs of young WT or NFATc2c3 double-deficient mice. Thps were activated, fixed, and stained as indicated, and imaged as described in Fig. 1. (a) Confocal images. Bars, 4 µm. (b) Quantification by linearization of whole-cell surface. Two independent experiments were analyzed and the mean of ρ was calculated for each cell (n = 93–145), as in Fig. 2.
Figure 8.
Figure 8.
Model of receptor exclusion from the IS. (top) IFNGR, TCR, Stat, phospho-STAT1, JAK3, and eventually the common γ chain (γc) colocalize after TCR signaling. Under these conditions, inhibitors could mediate the exclusion of IL4R from the IS. (middle) IL-4 signaling blocks the recruitment of IFNGR, STAT1, and phospho-STAT1 to the TCR-rich regions of the membrane. This phenomenon could be mediated by association of inhibitors to the IFNGR and/or recruitment of γc-JAK3 to the IL4R complex. Bottom panel. In the absence of pro-Th1 molecules, IFNGR, or STAT1, the IL4R is licensed to enter the IS to induce Th2 differentiation.

References

    1. Szabo S.J., Sullivan B.M., Peng S.L., Glimcher L.H. 2003. Molecular mechanisms regulating Th1 immune responses.Annu. Rev. Immunol. 21:713–758 - PubMed
    1. Murphy K.M., Reiner S.L. 2002. The lineage decisions of helper T cells.Nat. Rev. Immunol. 2:933–944 - PubMed
    1. Davis D.M., Dustin M.L. 2004. What is the importance of the immunological synapse? Trends Immunol. 25:323–327 - PubMed
    1. Friedl P., den Boer A.T., Gunzer M. 2005. Tuning immune responses: diversity and adaptation of the immunological synapse.Nat. Rev. Immunol. 5:532–545 - PubMed
    1. Grakoui A., Bromley S.K., Sumen C., Davis M.M., Shaw A.S., Allen P.M., Dustin M.L. 1999. The immunological synapse: a molecular machine controlling T cell activation.Science. 285:221–227 - PubMed

Publication types

MeSH terms