. 2009 Apr 6;185(1):77-85.
doi: 10.1083/jcb.200812077.

Molecular signatures of cell migration in C. elegans Q neuroblasts

Affiliations

Molecular signatures of cell migration in C. elegans Q neuroblasts

Guangshuo Ou et al. J Cell Biol. .

Abstract

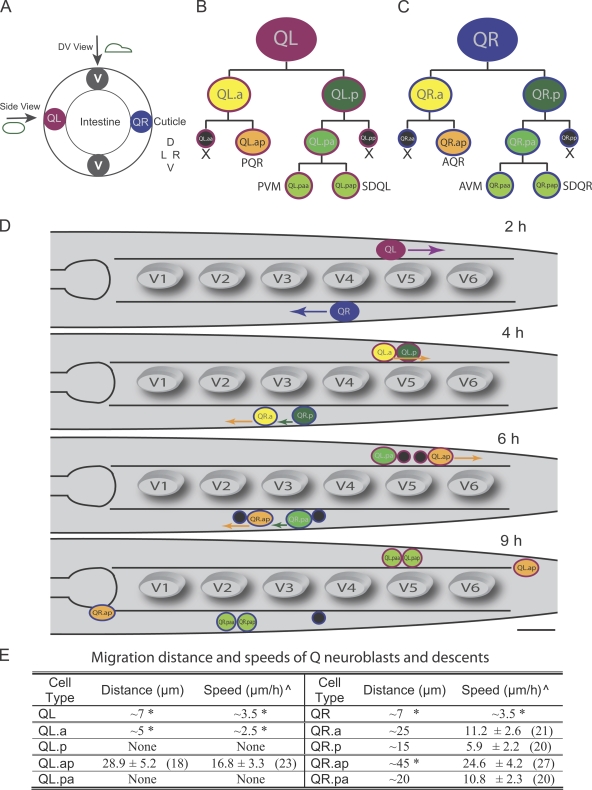
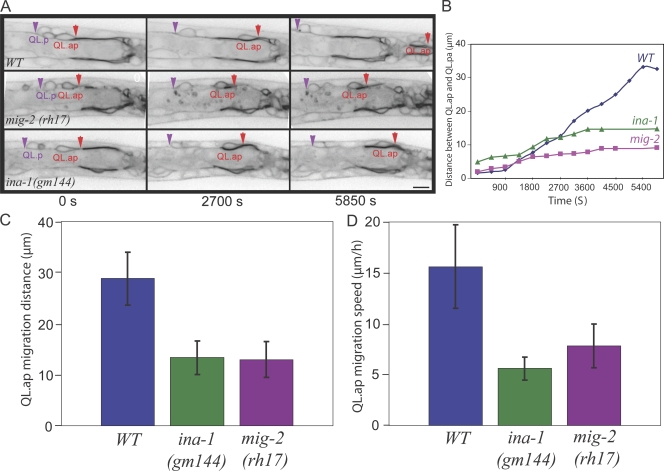
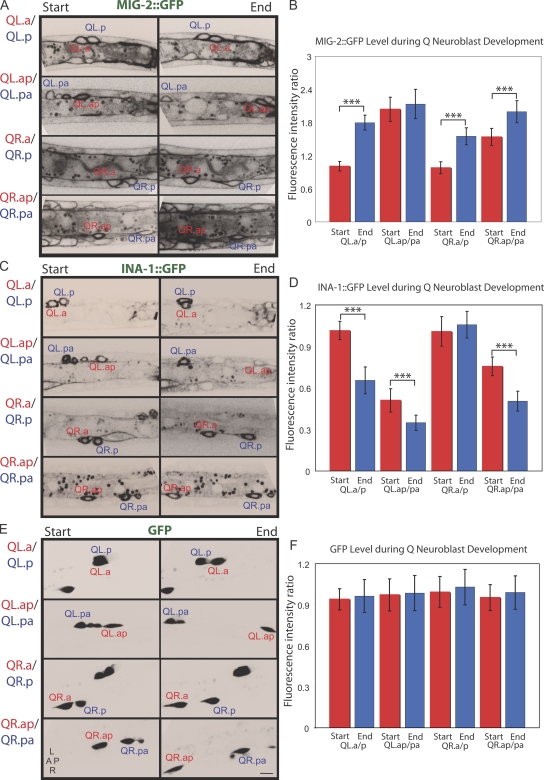
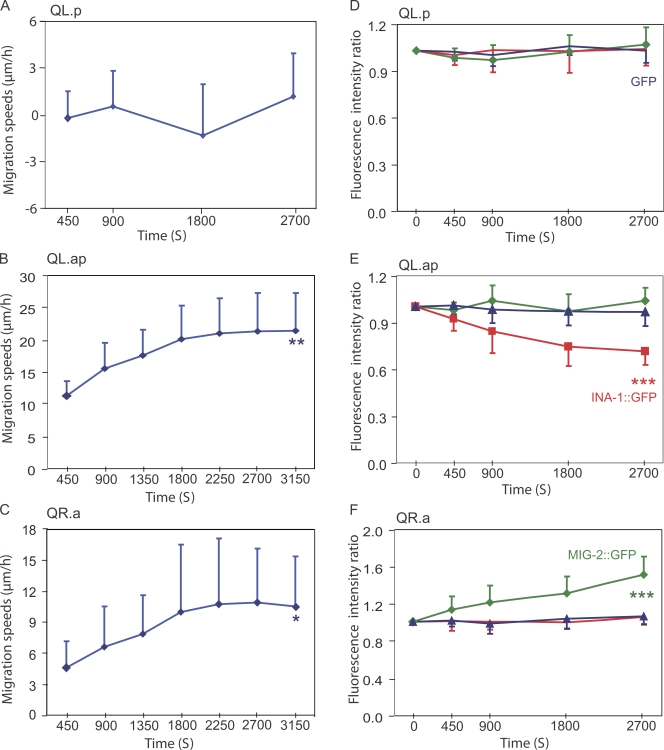
Metazoan cell movement has been studied extensively in vitro, but cell migration in living animals is much less well understood. In this report, we have studied the Caenorhabditis elegans Q neuroblast lineage during larval development, developing live animal imaging methods for following neuroblast migration with single cell resolution. We find that each of the Q descendants migrates at different speeds and for distinct distances. By quantitative green fluorescent protein imaging, we find that Q descendants that migrate faster and longer than their sisters up-regulate protein levels of MIG-2, a Rho family guanosine triphosphatase, and/or down-regulate INA-1, an integrin alpha subunit, during migration. We also show that Q neuroblasts bearing mutations in either MIG-2 or INA-1 migrate at reduced speeds. The migration defect of the mig-2 mutants, but not ina-1, appears to result from a lack of persistent polarization in the direction of cell migration. Thus, MIG-2 and INA-1 function distinctly to control Q neuroblast migration in living C. elegans.


Figures

Figure 1.
Figure 1.
Q neuroblasts lineage and the migration properties of the descendants. (A) The position of Q neuroblasts in a cross section of the nematode C. elegans. D, dorsal; V, ventral; L, left; R, right. (B and C) QL and QR neuroblasts lineage patterns, which produce three different neurons and two apoptotic cells (in black and marked by X) are shown. The products of these divisions give rise to ciliated sensory neurons (AQR and PQR), touch sensory neurons (AVM and PVM), and interneurons (SDQL and SDQR). (D) The migration of Q neuroblasts and their descendants in the L1 larva stage. Arrows indicate the migration direction. The time given is the hours after hatching. V1–V6, epithelial seam V1–V6 cells. Bar, 10 µm. (E) Summary of the migration distance and speeds of Q neuroblasts and their descendants. Asterisks denote values derived from the figures of previously published data (see Materials and methods). Other measurements are derived from our time-lapse observations. Carets indicate mean speed ± SEM (number of animals).
Figure 2.
Figure 2.
MIG-2 and INA-1 control the cell migratory capacity of QL.ap. (A) QL.ap migrates toward the tail in a WT animal but fails to complete its posterior migration in mig-2(rh17) or ina-1(gm144) mutant animals. The plasma membrane of QL.ap is visualized by the expression of MIG-2∷GFP (image is inverted so that higher GFP intensity is black). The leading edge of QL.ap is marked by red arrows, and the rear of the stationary QL.p is marked by purple arrowheads. Bar, 5 µm. (B) The distance between QL.ap and QL.pa during migration in WT, ina-1(gm144), and mig-2(rh17). (C) The final migration distances of QL.ap in ina-1(gm144) (13.3 ± 3.3 µm, n = 22) and mig-2(rh17) (13.0 ± 3.5 µm, n = 11) mutants are shorter than that in WT (28.9 ± 5.2 µm, n = 18). Error bars indicate SEM. (D) The migration speeds of QL.ap in ina-1(gm144) (5.6 ± 1.2 µm/h, n = 12) and mig-2(rh17) (7.8 ± 2.1 µm/h, n = 11) mutants are slower than in WT (16.8 ± 3.3 µm/h, n = 23).
Figure 3.
Figure 3.
Changes in MIG-2 and INA-1 protein levels during Q cell migration. (A–F) MIG-2∷GFP (A and B), INA-1∷GFP (C and D), and soluble GFP (E and F) were imaged at the start and end stage of migration of the indicated four pairs of Q neuroblast descendants. (A, C, and E) Images of Q cells at the start and the end of migration are shown. (B, D, and F) Fluorescence intensities of MIG-2∷GFP (n = 17–29), INA-1∷GFP (n = 17–33), and GFP (n = 12) expressed as a ratio between four Q descendant pairs are shown. ***, statistical significance of difference in the fluorescence intensity ratio between the start and the end (P < 0.001, Student's t test). Error bars indicate SEM. The absolute protein levels for each cell are shown in Fig. S3 (A–C). L, left; R, right; A, anterior; P, posterior. Bar, 5 µm.
Figure 4.
Figure 4.
Changes in MIG-2 and INA-1 protein levels during the migration of QL.p, QL.ap, and QR.a cells. (A–C) The migration speeds during different time periods measured for QL.p (n = 11), QL.ap (n = 9), and QR.a cells (n = 8). The QL.p is effectively stationary. (D–F) The fluorescence intensity ratio measured during different time periods of migration (compared with intensity at time 0) of MIG-2∷GFP (green; n = 8–11), INA-1∷GFP (red; n = 8–12), and soluble GFP (blue; n = 10–11). Error bars indicate mean ± SD. Statistical significances of the data (comparison between the start and end points of speed and fluorescence) are determined by Student's t test. *, P < 0.025; **, P < 0.005; ***, P < 0.001.
Figure 5.
Figure 5.
MIG-2, but not INA-1, polarizes migrating Q neuroblasts. (A–C) The morphology of migrating QL.ap cell visualizing from the left/right lateral side of C. elegans L1 larva expressing soluble GFP in WT (A), mig-2(rh17) (B), and ina-1(gm144) mutants (C). This GFP marker stains the Q cell periphery and the nucleus. The top panels show the first frames of QL.ap migration from Videos 7–9. Numbers 1, 2, and 3 indicate the QL.ap positions at 0 (1; the first frame), 30 (2), or 60 min (3) during migration from Videos 7–9. QL.ap in mig-2(rh17) (B) or ina-1(gm144) (C) migrates slower and shorter than its migration in WT (A). The bottom three panels show the magnified views of cell morphology of migrating QL.ap paired with schematic diagrams from the top panels or frames in Videos 7–9. Migrating QL.ap properly polarizes the lamellae toward the posterior in WT (A; 100%, n = 15) and in ina-1(gm144) (C; 92%, n = 12). However, in mig-2(rh17), QL.ap forms protrusions in random directions, marked by red asterisks. The anterior (A)–posterior (P) axis is the left to right. Light green, cytoplasm; dark green, nuclei. Bars, 5 µm.

References

    1. Avraamides C.J., Garmy-Susini B., Varner J.A. 2008. Integrins in angiogenesis and lymphangiogenesis.Nat. Rev. Cancer. 8:604–617 - PMC - PubMed
    1. Baum P.D., Garriga G. 1997. Neuronal migrations and axon fasciculation are disrupted in ina-1 integrin mutants.Neuron. 19:51–62 - PubMed
    1. Branda C.S., Stern M.J. 2000. Mechanisms controlling sex myoblast migration in Caenorhabditis elegans hermaphrodites.Dev. Biol. 226:137–151 - PubMed
    1. Burdine R.D., Chen E.B., Kwok S.F., Stern M.J. 1997. egl-17 encodes an invertebrate fibroblast growth factor family member required specifically for sex myoblast migration in Caenorhabditis elegans.Proc. Natl. Acad. Sci. USA. 94:2433–2437 - PMC - PubMed
    1. Cordes S., Frank C.A., Garriga G. 2006. The C. elegans MELK ortholog PIG-1 regulates cell size asymmetry and daughter cell fate in asymmetric neuroblast divisions.Development. 133:2747–2756 - PubMed

Publication types

MeSH terms