. 2009 Apr 6;185(1):101-14.
doi: 10.1083/jcb.200808082.

hPOC5 is a centrin-binding protein required for assembly of full-length centrioles

Affiliations

hPOC5 is a centrin-binding protein required for assembly of full-length centrioles

Juliette Azimzadeh et al. J Cell Biol. .

Abstract

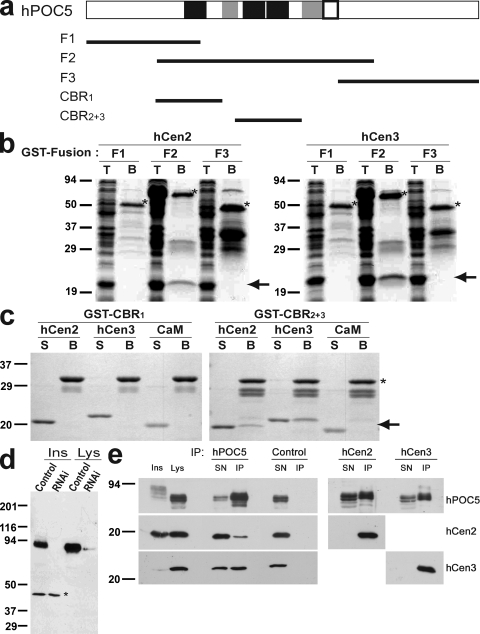
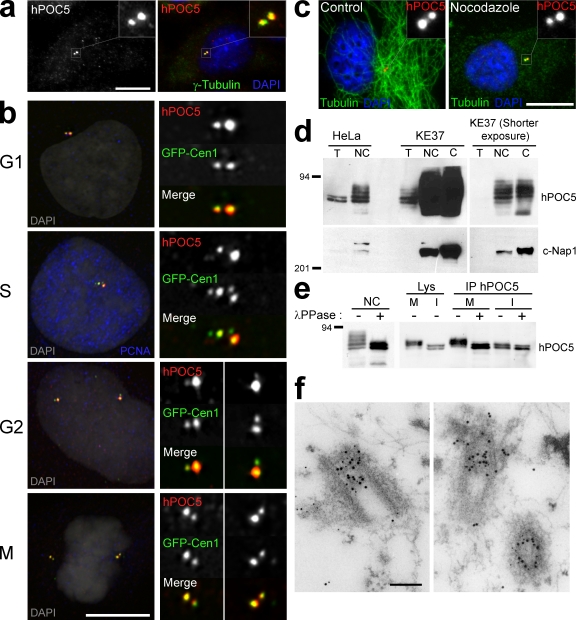
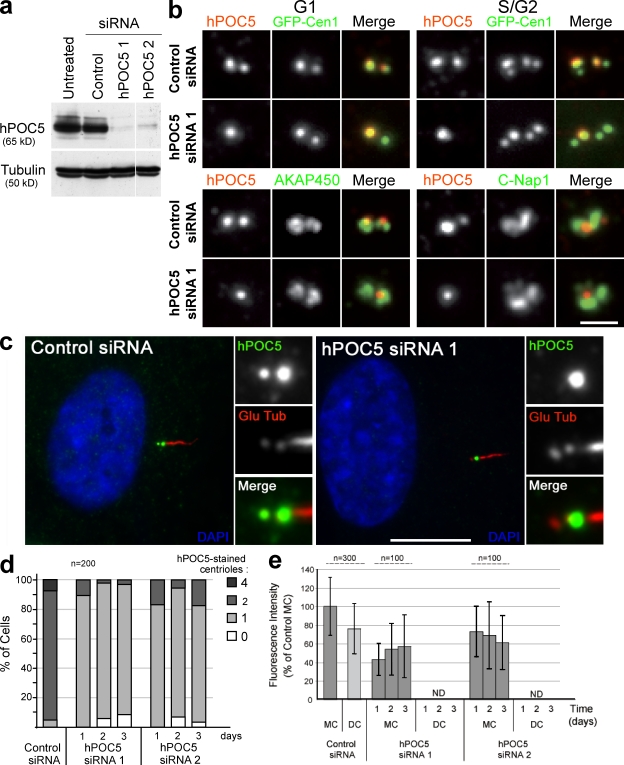
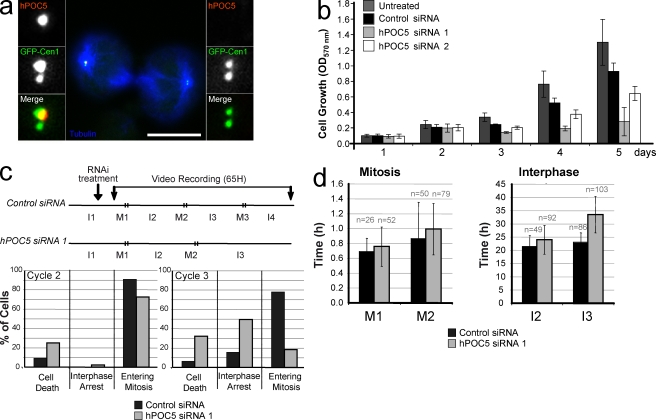
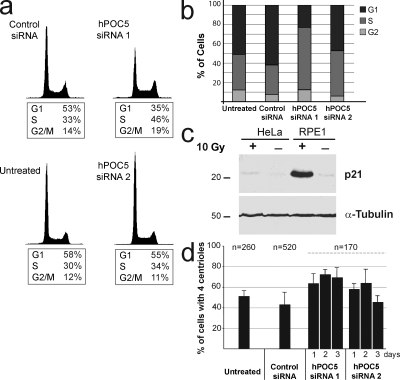
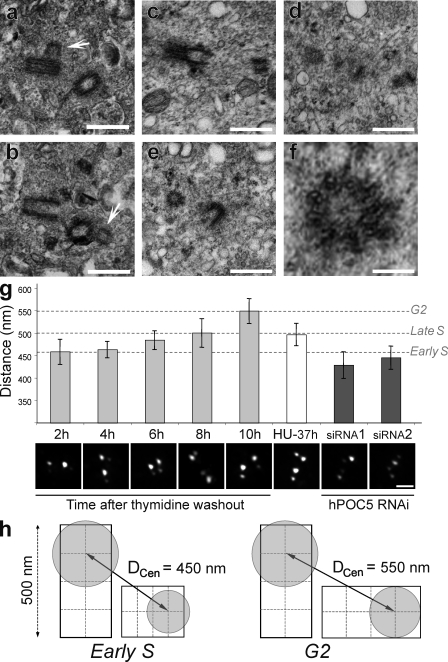
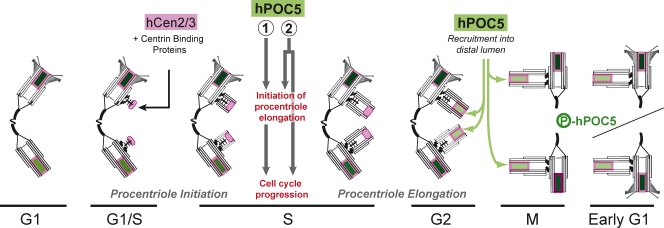
Centrin has been shown to be involved in centrosome biogenesis in a variety of eukaryotes. In this study, we characterize hPOC5, a conserved centrin-binding protein that contains Sfi1p-like repeats. hPOC5 is localized, like centrin, in the distal portion of human centrioles. hPOC5 recruitment to procentrioles occurs during G2/M, a process that continues up to the full maturation of the centriole during the next cell cycle and is correlated with hyperphosphorylation of the protein. In the absence of hPOC5, RPE1 cells arrest in G1 phase, whereas HeLa cells show an extended S phase followed by cell death. We show that hPOC5 is not required for the initiation of procentriole assembly but is essential for building the distal half of centrioles. Interestingly, the hPOC5 family reveals an evolutionary divergence between vertebrates and organisms like Drosophila melanogaster or Caenorhabditis elegans, in which the loss of hPOC5 may correlate with the conspicuous differences in centriolar structure.


Figures

Figure 1.
Figure 1.
hPOC5 is a conserved protein. (a) Schematic representation of hPOC5 and predicted homologues in C. reinhardtii and P. tetraurelia. The putative Sfi1p-like CBRs are indicated in pink, the predicted coiled-coil regions are indicated in green, and the conserved 21-aa signature domain indicated in orange. The size of the predicted full-length proteins is indicated. (b) Alignment of the central region of POC5 family members: human (available from GenBank/EMBL/DDBJ under accession no. NP_001092741), zebrafish (XP_691080), sea urchin (XP_797483), T. brucei (XP_822994), L. major (XP_001686847), G. lamblia (XP_001705095.1), C. reinhardtii (version 3.0 available from the Chlamydomonas Center under accession no. 144089), and P. tetraurelia (available from the Paramecium Database under accession no. GSPATP00029936001). Positions at which ≥75% of amino acid residues are identical or similar between proteins are shaded. Identical residues are shaded in black, and similar residues are shaded in gray. Domains depicted in panel a are reported using the same colors on the protein sequences. (c) ClustalW phylogenetic tree of the POC5 family based on the neighbor-joining method. 1,000 replicates were performed. Bootstrap values are displayed as percentages at each node. Bar, 0.1 substitutions/1 aa.
Figure 2.
Figure 2.
hPOC5 binds human centrin proteins through the conserved Sfi1p-like repeats. (a) Maps of the GST fusions used in b and c on a schematic representation of hPOC5 in which CBRs are shown in black, coiled-coil domains are shown in gray, and the POC5 signature domain is outlined in black. (b) GST fusions F1–3 were coexpressed in E. coli with hCen2 or hCen3 and pulled down using glutathione beads. T, total E.coli extract; B, beads. (c) Fusions containing only the first predicted CBR (CBR1) or the central conserved tandem repeat (CBR2+3) were bound to glutathione beads and incubated with 5 µM untagged hCen2, hCen3, or CaM. S, supernatant after the pull-down. In b and c, the GST fusions are indicated by an asterisk, and hCen2/3 or CaM is indicated by an arrow. (d) Affinity-purified anti-hPOC5 labels a major band in HeLa cell lysates that can be further resolved into a doublet and slow migrating species in insoluble extracts, which are decreased by treatment with hPOC5 siRNA1. An insoluble polypeptide of ∼45 kD that is not affected by RNAi, likely resulting from a cross-reaction, is indicated by an asterisk. Ins, insoluble; Lys, lysate. (e) Anti-hPOC5 but not control antibody immunoprecipitated endogenous hCen2/3 from HeLa cell lysates (left). Similarly, endogenous hPOC5 was immunoprecipitated by anti-hCen2 and anti-hCen3 (right). SN, IP supernatant; IP, immunoprecipitated material. (b–e) Molecular mass is indicated in kilodaltons.
Figure 3.
Figure 3.
hPOC5 is a centriolar phosphoprotein. (a) HeLa cell stained with affinity-purified anti-hPOC5 antibody (shown in red) and anti–γ-tubulin antibody (shown in green). DAPI is shown in blue. (b) Localization of hPOC5 during the cell cycle. RPE1 cells expressing the GFP-Cen1 construct were labeled with affinity-purified anti-hPOC5 and anti-PCNA antibody. S cells exhibit a nuclear PCNA staining; among PCNA-negative cells, GFP-Cen1 allows us to distinguish G1 cells that have a single centrosome from G2 cells that have duplicated centrosomes. hPOC5 is shown in red, GFP-Cen1 is shown in green, PCNA is shown in blue, and DAPI is shown in gray on merged pseudocolor images. (c) Control or nocodazole-treated HeLa cells labeled with anti-hPOC5 (red) and anti-tubulin (green). DAPI is shown in blue. (d) hPOC5 is highly enriched in centrosome fractions. Centrosome-nucleus (NC) or isolated centrosome (C) fractions prepared from HeLa and KE37 cells or KE37 cells only, respectively, were stained with anti-hPOC5 or anti–C-Nap1 as a marker. T, total protein extract. (e) hPOC5 is a phosphoprotein. (left) Centrosome-nucleus fractions were incubated with λ-phosphatase (+) or buffer alone (−) and stained with anti-hPOC5. (right) hPOC5 immunoprecipitated from mitotic (M) or interphase (I) HeLa cell lysates was incubated with λ-phosphatase (+) or buffer alone (−) and revealed with anti-hPOC5. Lys, lysate; IP, immunoprecipitated material. (d and e) Molecular mass is indicated in kilodaltons. (f) Postembedding immunogold colocalization of hPOC5 (10-nm gold particles) and hCen3 (5-nm gold particles) in HeLa cells. (a and c) Insets show magnifications of the boxed areas. Bars: (a–c) 10 µm; (f) 0.2 µm.
Figure 4.
Figure 4.
hPOC5 is stably incorporated into mother centrioles. (a) hPOC5 levels in HeLa cells treated for 48 h with two different hPOC5 siRNAs or control siRNA. Anti-tubulin was used as a loading control. (b, top) G1 (left) or S/G2 (right) GFP-Cen1–expressing cells treated with control or hPOC5 siRNA 1 for 48 h and stained with anti-hPOC5 (red). (bottom) siRNA-treated HeLa cells labeled with anti-hPOC5 (red) and CTR453 antibody recognizing centrosome-associated AKAP450 or anti–C-Nap1 (green). (c) RPE1 cells treated with control or hPOC5 siRNA 1 and stained with anti-hPOC5 (green) and anti–polyglutamylated tubulin antibody GT335 (Glu Tub; red). DAPI is shown in blue. Insets show magnifications of the centrosome area. (d) Quantification of the number of centrioles labeled by anti-hPOC5 in control and hPOC5 siRNA–treated cells over time. Values are from a single experiment representative of four experiments. (e) Quantification of hPOC5 levels in GFP-Cen1–expressing cells treated with hPOC5 siRNAs for 1–3 d. The values are shown as percentages of the mean fluorescence intensity of the mother centriole in control cells. In hPOC5-depleted cells, hPOC5 fluorescence intensity associated with daughter centrioles labeled by GFP-Cen1 was indistinguishable from the background levels and could not be quantified using the same method (ND). Results were obtained from three different experiments. Error bars represent SD. (d and e) n = total number of cells counted. Bars: (b) 1 µm; (c) 10 µm.
Figure 5.
Figure 5.
hPOC5 is an essential protein. (a) Dividing GFP-Cen1–expressing HeLa cells after 48-h treatment with hPOC5 siRNA 1 and stained with anti-hPOC5 (red) and anti-tubulin (blue). Insets show magnifications of each spindle pole area. (b) Cell growth is affected by hPOC5 depletion. HeLa cells were siRNA treated twice at t = 0 and 2 d later and fixed at designated time points, and cell growth was determined after violet crystal staining (OD570). Results were obtained from three independent measurements in three independent experiments. Mean values ± SD are shown. (c) Fate of HeLa cells treated with hPOC5 siRNA 1 observed by time-lapse imaging. (top) Experimental protocol. Asynchronous HeLa cells were treated with hPOC5 siRNA 1 or control siRNA and video recorded for 65 h starting 6 h after the beginning of siRNA treatment. I, interphase; M, mitosis. (bottom) Percentages of interphase cells that either died, arrested in interphase until the end of the recording, or entered mitosis during interphase 2 (left) or 3 (right). (d) hPOC5-depleted cells exhibit a delay in interphase. Duration of mitosis and interphase of HeLa cells treated with hPOC5 siRNA 1 or control siRNA. Results in c and d were obtained by analysis of time-lapse images of individual cells from two independent experiments. n = total number of cells counted. Error bars represent SD. Bar, 10 µm.
Figure 6.
Figure 6.
hPOC5-depleted cells arrest in S phase. (a) HeLa cells were treated with hPOC5 siRNAs for 72 h and analyzed by flow cytometry. Results are from a single experiment representative of three experiments. (b) Cell cycle analysis of hPOC5- or control siRNA–treated GFP-Cen1 HeLa cells after BrdU incorporation and cyclin B1 staining. Results were obtained from two independent experiments. (c) HeLa and RPE1 cells were irradiated with 10 Gy of γ irradiation and subjected to Western blot analysis. α-Tubulin was used as a loading control. Molecular mass is indicated in kilodaltons. (d) siRNA-depleted cells accumulate in S phase with duplicated centrosomes. RNAi was performed in GFP-Cen1–expressing cells, and the number of GFP-stained centrioles per cell was counted. Results were obtained from three independent experiments. n = total number of cells counted. Error bars represent SD.
Figure 7.
Figure 7.
hPOC5-depleted HeLa cells accumulate with short procentrioles. (a and b) HeLa cells treated with hPOC5 siRNA 1 for 48 or 72 h were glutaraldehyde fixed and randomly selected for serial-thin sectioning. Panels a and b show two consecutive sections of the same centrosome. Arrows show the procentrioles. (c–e) HeLa cells were treated with siRNA 1 for 48 h, and round-shaped cells were collected by mitotic shake-off and glutaraldehyde fixed. Panels c, d, and e show three consecutive sections of the same centrosome. Panel f shows a magnification of the procentriole seen in the transverse section in e. (g) Elongation of the procentriole was estimated by measuring the distance between the center of mass of the two dots of GFP-Cen1 staining within each pair of orthogonally arranged centrioles (DCen) in GFP-Cen1–expressing HeLa cells with duplicated centrosomes. The graph shows the mean value of the highest 20% of values obtained from series of 100 measurements ± SD. The highest values are obtained when DCen is parallel to the plan of imaging and, thus, represent a better approximation of the real distance. DCen was measured in control cells synchronized by a double thymidine block at the indicated time points after thymidine washout (2–10 h) as well as in synchronized control cells arrested in S phase by HU treatment for 37 h (HU-37 h). These values were compared with DCen measured in cells treated by hPOC5 siRNAs 1 and 2 that exhibited duplicated centrosomes. Micrographs show the GFP-Cen1 staining in a representative cell for each condition. (h) Schematic representation of DCen measured in diplosomes from early S- or G2-phase cells. The center of mass of the GFP staining (gray circles) is assumed to be centered on the distal end of each centriole. Bars: (a–e) 0.5 µm; (f) 0.1 µm.
Figure 8.
Figure 8.
Model for the role of hPOC5 in centriole assembly. In control cells, the duplication starts during late G1 or early S phase by the assembly of a precursor structure containing a cartwheel that contains centrin proteins (shaded in pink) but not hPOC5. Centrin proteins are likely to interact at this step with another unidentified centrin-binding protein. During early S phase, microtubule singlets then doublets are assembled around the cartwheel. During mid or late S phase, either (1) hPOC5 is required to initiate procentriole elongation and this, in turn, allows cell cycle progression, or (2) hPOC5 triggers procentriole elongation and performs an additional function required for progression through S phase independently. During G2 phase, hPOC5 (shaded in green) starts to accumulate in the distal lumen of procentrioles, concomitantly to its phosphorylation, and keeps accumulating during the subsequent cell cycle together with centrin.

References

    1. Adams I.R., Kilmartin J.V. 2000. Spindle pole body duplication: a model for centrosome duplication? Trends Cell Biol. 10:329–335 - PubMed
    1. Andersen J.S., Wilkinson C.J., Mayor T., Mortensen P., Nigg E.A., Mann M. 2003. Proteomic characterization of the human centrosome by protein correlation profiling.Nature. 426:570–574 - PubMed
    1. Araki M., Masutani C., Takemura M., Uchida A., Sugasawa K., Kondoh J., Ohkuma Y., Hanaoka F. 2001. Centrosome protein centrin 2/caltractin 1 is part of the xeroderma pigmentosum group C complex that initiates global genome nucleotide excision repair.J. Biol. Chem. 276:18665–18672 - PubMed
    1. Azimzadeh J., Bornens M. 2004. The centrosome in evolution. Centrosomes in Development and Disease. Nigg E.A., editor Wiley-VCH, Weinheim, Germany: 93–122
    1. Baroin A., Perasso R., Qu L.H., Brugerolle G., Bachellerie J.P., Adoutte A. 1988. Partial phylogeny of the unicellular eukaryotes based on rapid sequencing of a portion of 28S ribosomal RNA.Proc. Natl. Acad. Sci. USA. 85:3474–3478 - PMC - PubMed

Publication types

MeSH terms

Substances