

Influence of intracranial aneurysm-to-parent vessel size ratio on hemodynamics and implication for rupture: results from a virtual experimental study
- PMID: 19349824
- PMCID: PMC2775481
- DOI: 10.1227/01.NEU.0000341529.11231.69
Influence of intracranial aneurysm-to-parent vessel size ratio on hemodynamics and implication for rupture: results from a virtual experimental study
Abstract
Objective: The effectiveness of intracranial aneurysm (IA) size as a predictor for rupture has been debated. We recently performed a retrospective analysis of IA morphology and found that a new index, namely, aneurysm-to-parent vessel size ratio (SR), was strongly correlated with IA rupture, with 77% of ruptured IAs showing an SR of more than 2, and 83% of unruptured IAs showing an SR of 2 or less. As hemodynamics have been implicated in both IA development and rupture, we examine how varying SR influences intra-aneurysmal hemodynamics.
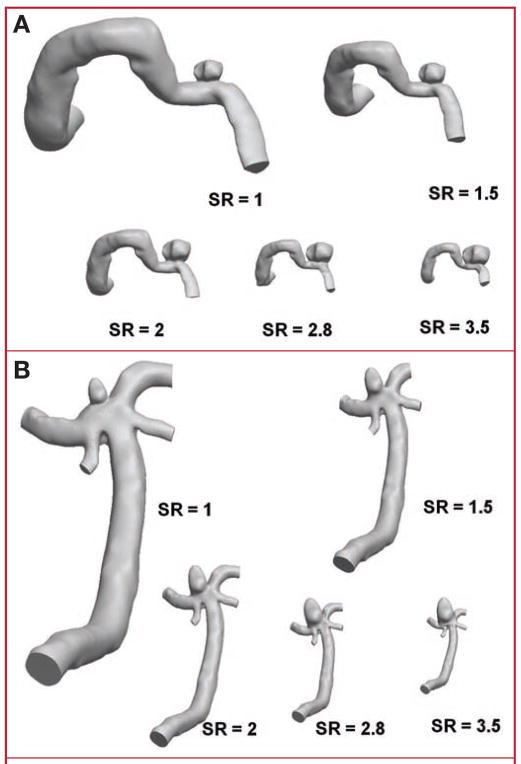
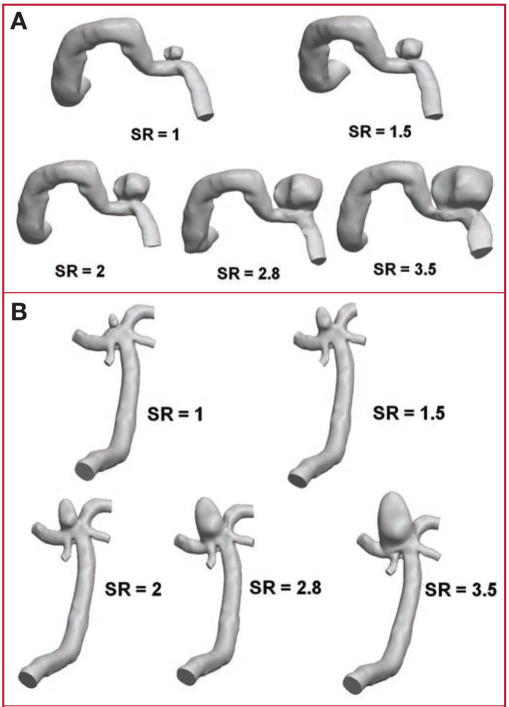
Methods: One sidewall and 1 terminal IA were virtually reconstructed from patient 3-dimensional angiographic images. In 2 independent in silico experiments, the SR was varied from 1.0 to 3.5 by virtually changing either aneurysm size or vessel diameter while keeping the other parameter constant. Pulsatile computational fluid dynamics simulations were performed on each model for hemodynamics analysis.
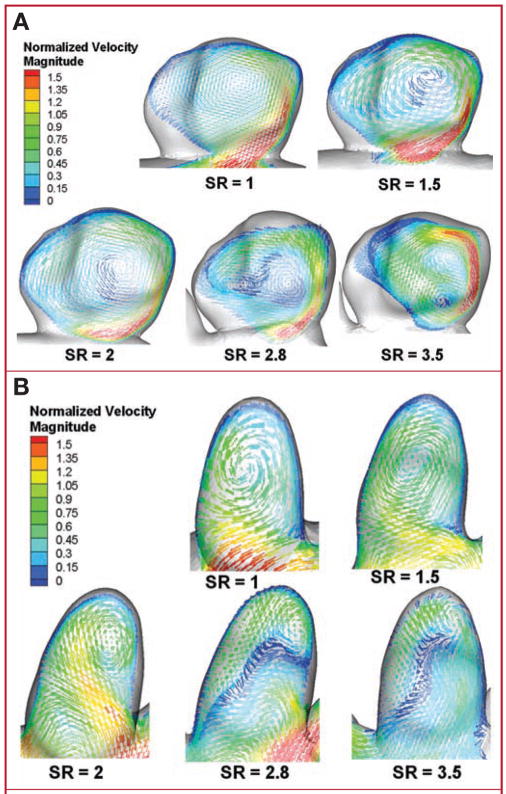
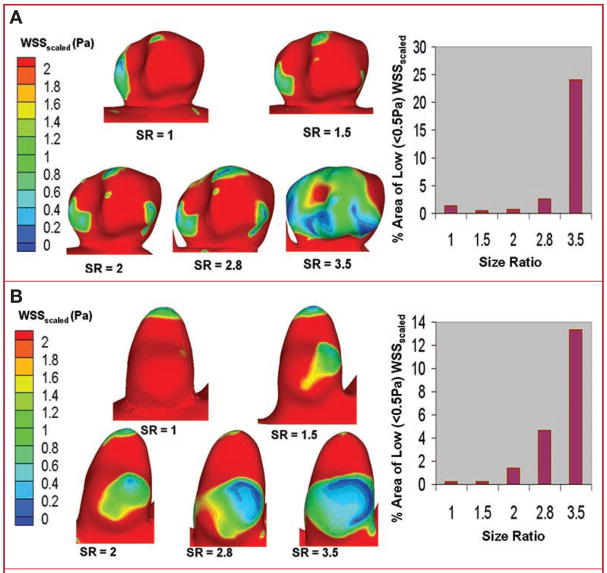
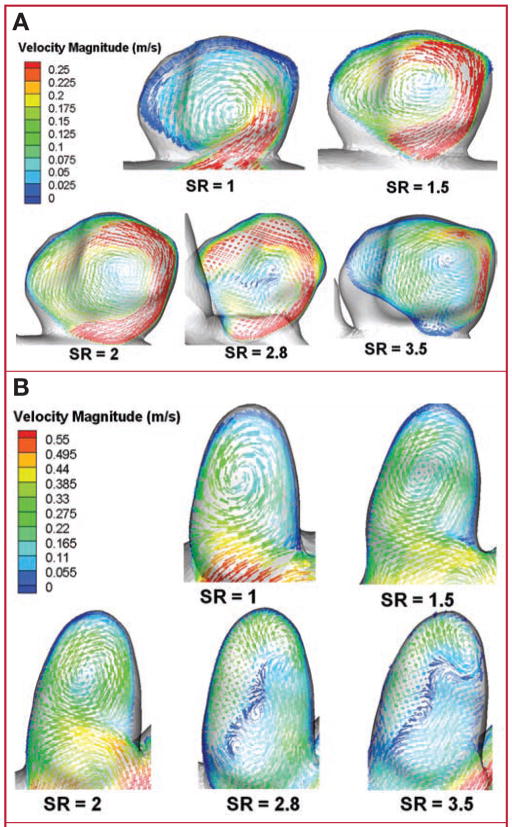
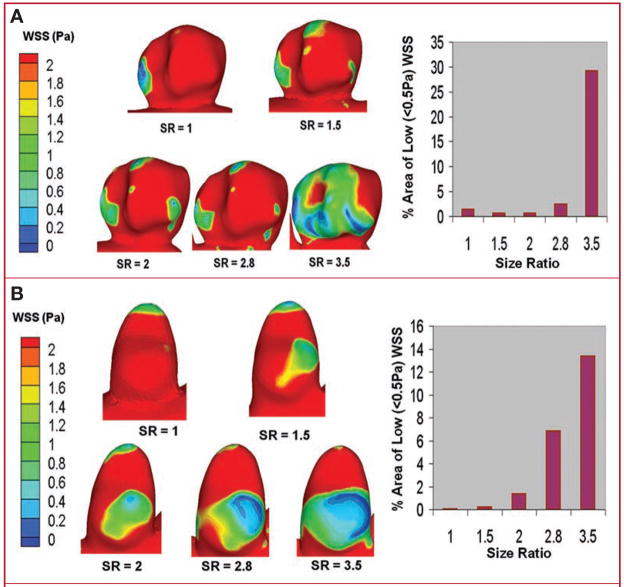
Results: Low SR (</=2) aneurysm morphology consistently demonstrated simple flow patterns with a single intra-aneurysmal vortex, whereas higher SR (>2) aneurysm morphology presented multiple vortices and complex flow patterns. The aneurysm luminal area that was exposed to low wall shear stress increased with increasing SR. Complex flow, multiple vortices, and low aneurysmal wall shear stress have been associated with ruptured IAs in previous studies.
Conclusion: Higher SR, irrespective of aneurysm type and absolute aneurysm or vessel size, gives rise to flow patterns typically observed in ruptured IAs. These results provide hemodynamic support for the existing correlation of SR with rupture risk.
Figures
References
-
- Aaslid R, Markwalder TM, Nornes H. Noninvasive transcranial Doppler ultrasound recording of flow velocity in basal cerebral arteries. J Neurosurg. 1982;57:769–774. - PubMed
-
- Ausman JI, Roitberg B. A response from the ISUIA. International Study on Unruptured Intracranial Aneurysms. Surg Neurol. 1999;52:428–430. - PubMed
-
- Beck J, Rohde S, Berkefeld J, Seifert V, Raabe A. Size and location of ruptured and unruptured intracranial aneurysms measured by 3-dimensional rotational angiography. Surg Neurol. 2006;65:18–27. - PubMed
-
- Brooks DE, Goodwin JW, Seaman GV. Interactions among erythrocytes under shear. J Appl Physiol. 1970;28:172–177. - PubMed
-
- Burleson AC, Strother CM, Turitto VT. Computer modeling of intracranial saccular and lateral aneurysms for the study of their hemodynamics. Neurosurgery. 1995;37:774–784. - PubMed
MeSH terms
Grants and funding
LinkOut - more resources
Full Text Sources
Medical
Research Materials
