Meta-analysis of 32 genome-wide linkage studies of schizophrenia
- PMID: 19349958
- PMCID: PMC2715392
- DOI: 10.1038/mp.2008.135
Meta-analysis of 32 genome-wide linkage studies of schizophrenia
Abstract
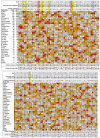
A genome scan meta-analysis (GSMA) was carried out on 32 independent genome-wide linkage scan analyses that included 3255 pedigrees with 7413 genotyped cases affected with schizophrenia (SCZ) or related disorders. The primary GSMA divided the autosomes into 120 bins, rank-ordered the bins within each study according to the most positive linkage result in each bin, summed these ranks (weighted for study size) for each bin across studies and determined the empirical probability of a given summed rank (P(SR)) by simulation. Suggestive evidence for linkage was observed in two single bins, on chromosomes 5q (142-168 Mb) and 2q (103-134 Mb). Genome-wide evidence for linkage was detected on chromosome 2q (119-152 Mb) when bin boundaries were shifted to the middle of the previous bins. The primary analysis met empirical criteria for 'aggregate' genome-wide significance, indicating that some or all of 10 bins are likely to contain loci linked to SCZ, including regions of chromosomes 1, 2q, 3q, 4q, 5q, 8p and 10q. In a secondary analysis of 22 studies of European-ancestry samples, suggestive evidence for linkage was observed on chromosome 8p (16-33 Mb). Although the newer genome-wide association methodology has greater power to detect weak associations to single common DNA sequence variants, linkage analysis can detect diverse genetic effects that segregate in families, including multiple rare variants within one locus or several weakly associated loci in the same region. Therefore, the regions supported by this meta-analysis deserve close attention in future studies.
Figures


References
-
- Pardi F, Levinson DF, Lewis CM. GSMA: software implementation of the genome search meta-analysis method. Bioinformatics. 2005;21:4430–4431. - PubMed
-
- Wise LH, Lanchbury JS, Lewis CM. Meta-analysis of genome searches. Ann Hum Genet. 1999;63(Part 3):263–272. - PubMed
-
- Risch N, Merikangas K. The future of genetic studies of complex human diseases. Science. 1996;273:1516–1517. - PubMed
Publication types
MeSH terms
Grants and funding
- 055379/WT_/Wellcome Trust/United Kingdom
- 5 U01MH46318/MH/NIMH NIH HHS/United States
- U01 MH046276/MH/NIMH NIH HHS/United States
- R01 MH060875/MH/NIMH NIH HHS/United States
- R01 MH068922/MH/NIMH NIH HHS/United States
- R01 MH062276/MH/NIMH NIH HHS/United States
- R01 MH041953/MH/NIMH NIH HHS/United States
- MH 56242/MH/NIMH NIH HHS/United States
- R01 MH080299/MH/NIMH NIH HHS/United States
- U01 MH046289/MH/NIMH NIH HHS/United States
- G880473N/MRC_/Medical Research Council/United Kingdom
- 089061/WT_/Wellcome Trust/United Kingdom
- R01-MH44245/MH/NIMH NIH HHS/United States
- 7R01MH062276/MH/NIMH NIH HHS/United States
- N01 HV048141/HL/NHLBI NIH HHS/United States
- MH062440/MH/NIMH NIH HHS/United States
- 5R01MH068881/MH/NIMH NIH HHS/United States
- 1R01 MH59624-01/MH/NIMH NIH HHS/United States
- MH60881/MH/NIMH NIH HHS/United States
- MH80299/MH/NIMH NIH HHS/United States
- G9309834/MRC_/Medical Research Council/United Kingdom
- R10 MH056242/MH/NIMH NIH HHS/United States
- MH61399/MH/NIMH NIH HHS/United States
- MH58586/MH/NIMH NIH HHS/United States
- 5R01MH068922/MH/NIMH NIH HHS/United States
- R01 MH060881/MH/NIMH NIH HHS/United States
- R01 MH062440/MH/NIMH NIH HHS/United States
- R01 MH061399/MH/NIMH NIH HHS/United States
- 5R01MH068921/MH/NIMH NIH HHS/United States
- R01 MH068881/MH/NIMH NIH HHS/United States
- MH63356/MH/NIMH NIH HHS/United States
- MH-41953/MH/NIMH NIH HHS/United States
- R01 MH068921/MH/NIMH NIH HHS/United States
- MH60875/MH/NIMH NIH HHS/United States
- R01 MH063356/MH/NIMH NIH HHS/United States
- U01 MH046318/MH/NIMH NIH HHS/United States
- G0801418/MRC_/Medical Research Council/United Kingdom
- G0400960/MRC_/Medical Research Council/United Kingdom
- R01 MH056242/MH/NIMH NIH HHS/United States
LinkOut - more resources
Full Text Sources
Medical
Research Materials
Miscellaneous

