. 2009 Apr;27(4):378-86.
doi: 10.1038/nbt.1532. Epub 2009 Apr 6.

Mass-spectrometric identification and relative quantification of N-linked cell surface glycoproteins

Affiliations

Mass-spectrometric identification and relative quantification of N-linked cell surface glycoproteins

Bernd Wollscheid et al. Nat Biotechnol. 2009 Apr.

Erratum in

  • Nat Biotechnol. 2009 Sep;27(9):864

Abstract

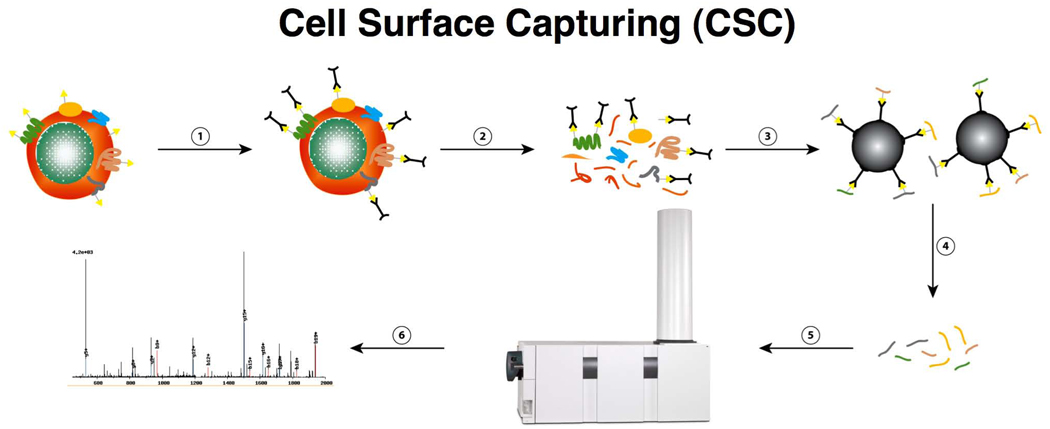
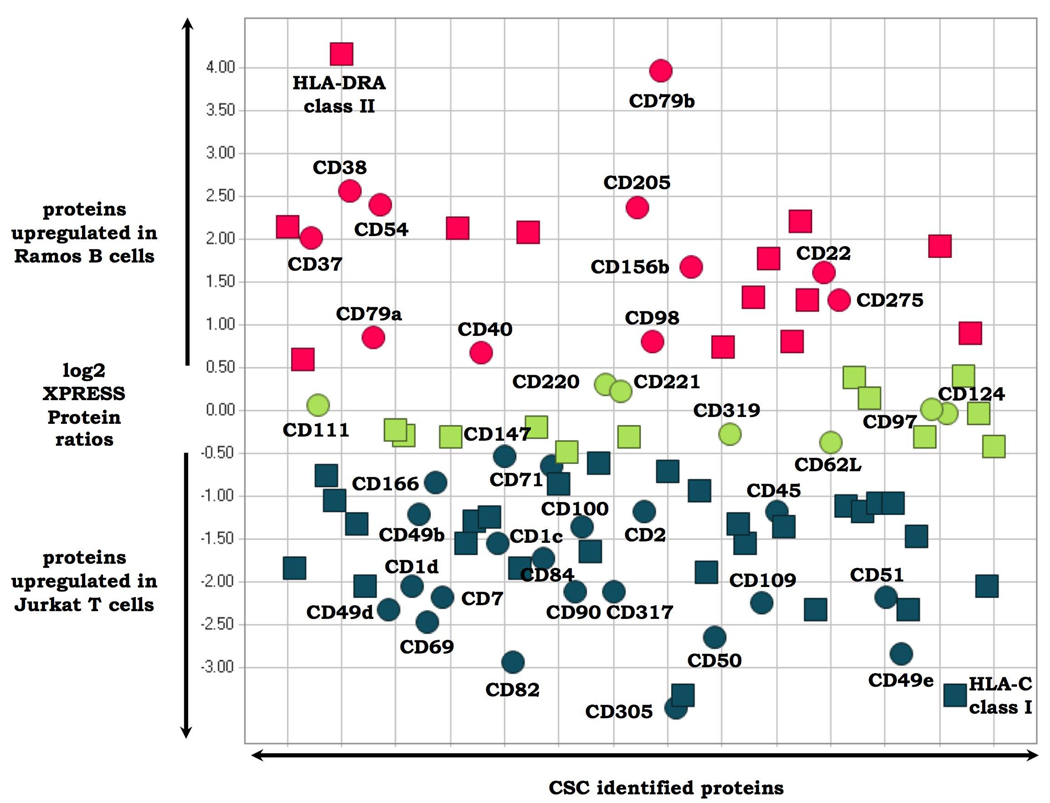
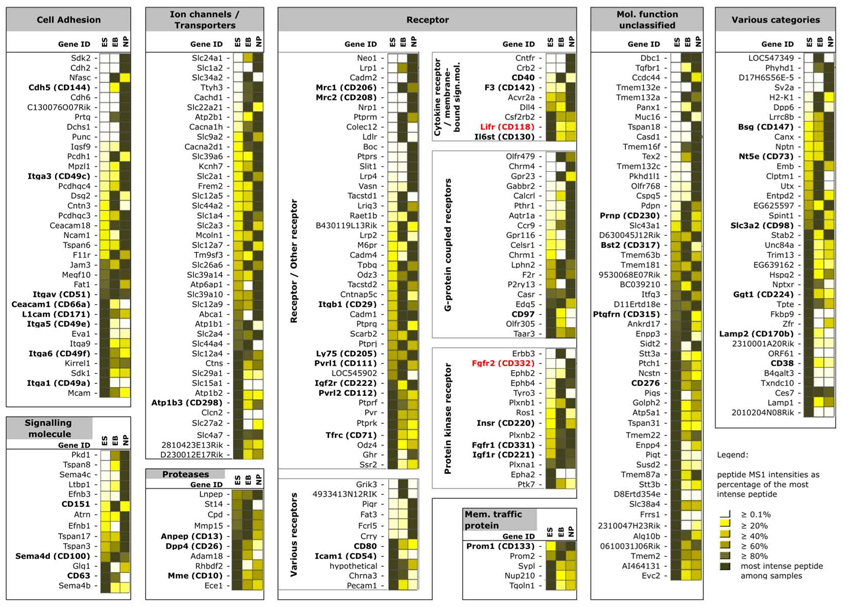
Although the classification of cell types often relies on the identification of cell surface proteins as differentiation markers, flow cytometry requires suitable antibodies and currently permits detection of only up to a dozen differentiation markers in a single measurement. We use multiplexed mass-spectrometric identification of several hundred N-linked glycosylation sites specifically from cell surface-exposed glycoproteins to phenotype cells without antibodies in an unbiased fashion and without a priori knowledge. We apply our cell surface-capturing (CSC) technology, which covalently labels extracellular glycan moieties on live cells, to the detection and relative quantitative comparison of the cell surface N-glycoproteomes of T and B cells, as well as to monitor changes in the abundance of cell surface N-glycoprotein markers during T-cell activation and the controlled differentiation of embryonic stem cells into the neural lineage. A snapshot view of the cell surface N-glycoproteins will enable detection of panels of N-glycoproteins as potential differentiation markers that are currently not accessible by other means.


Figures

Figure 1
Figure 1
CSC uses a multistep tandem affinity labeling strategy to confer the desired specificity for the glycoproteins on the cell surface. These steps involve (1) tagging reactive groups from plasma-membrane proteins (yellow triangles, glycans; black, bi-functional linker molecules), (2) cell homogenization, (3) protein digestion and affinity purification, (4) peptide release, (5) peptide analysis by LC-MS/MS and (6) peptide or protein identification.
Figure 2
Figure 2
The CSC reaction is selective for glycans on the cell surface. (a) Ungated FACS histogram showing three populations of Jurkat T-lymphocytes: control cells (red), cells treated with biocytin hydrazide only (orange) and cells treated with sodium periodate and biocytin hydrazide (green). The streptavidin-AF488 fluorophore was used for detection. (b) Confocal image of Jurkat T-lymphocytes upon visualization of the tagged cell-surface polysaccharides. Cells were oxidized, labeled with biotin hydrazide and incubated with streptavidin-AF488 (green) after permeabilization.
Figure 3
Figure 3
Specificity of the CSC technology and molecular functions of the proteins identified. 110 proteins were identified in a CSC experiment, including 43 CD proteins from Jurkat T-lymphocytes with a specificty of 95% for cell surface glycoproteins. 5% were identified nonspecifically. The PANTHER molecular function analysis of the 104 cell surface glycoproteins is displayed on the right.
Figure 4
Figure 4
Cell surface glycoproteins differentially expressed on Jurkat T versus Ramos B lymphocytes. Glycoproteins present on the cell surfaces of both cell types in similar amounts are depicted in green. Cell surface proteins which are upregulated on T cells versus B cells are depicted in blue. Cell surface proteins which are downregulated in B cells versus T cells are depicted in red. Circles indicate proteins which are CD annotated. Squares represent proteins without CD annotation. Selected CSC-identified proteins are labeled. Glycopeptides used to quantify all proteins are listed in Supplementary Table 8 and Supplementary Table 9 online.
Figure 5
Figure 5
Up- and downregulation of Jurkat T-cell proteins after costimulation with CD3/CD28 co-stimulation for 24h. Glycoproteins which are present on the cell surface before and after stimulation in similar amounts are depicted in green. Cell surface glycoproteins which are upregulated upon T-cell stimulation are depicted in red. Cell surface glycoproteins which are downregulated upon T-cell stimulation are depicted in blue. Circles indicate proteins which are CD annotated. Squares represent proteins with out Cd annotation. Selected CSC-identified proteins are labeled. Glycopeptides used to quantify allglycol proteins are listed in Supplementary Table 10 and Supplementary Table 11 online.
Figure 6
Figure 6
Up- and downregulation of glycoproteins on the surfaces of ES cells during their controlled differentiation into neural progenitors. Glycoproteins which are present on the cell surface at time point 1 (ES, ES cells), time point 2 (EB, embryoid bodies) and time point 3 (NP, neural progenitors) and their relative changes upon differentiation are depicted. The color code in the boxes adjacent to the Gene IDs indicates proteotypic peptide MS1 intensities calculated by SUPERHIRN as a percentage of the most intense peptide in shades of yellow. Fading yellow color in each row indicates less surface-expression and vice versa. Identified proteins cannot be directly compared with each other in terms of intensities within columns due to the MS approach used. CD-annotated proteins are shown in bold. Selected CSC-identified proteins mentioned in the text are labeled red. Full lists of all identified and quantified glycoproteins and glycopeptides are provided in Supplementary Table 12 and Supplementary Table 13 online, respectively.

References

    1. von Heijne G. The membrane protein universe: what's out there and why bother? J. Intern. Med. 2007;261:543–557. - PubMed
    1. Wollscheid B, et al. Lipid raft proteins and their identification in T lymphocytes. Subcell. Biochem. 2004;37:121–152. - PubMed
    1. Hosen N, et al. CD96 is a leukemic stem cell-specific marker in human acute myeloid leukemia. Proc. Natl. Acad. Sci. USA. 2007;104:11008–11013. - PMC - PubMed
    1. Hopkins AL, Groom CR. The druggable genome. Nat. Rev. Drug Discov. 2002;1:727–730. - PubMed
    1. Stewart CC, Nicholson JKA. Immunophenotyping. Wiley-Liss: New York; 2000.

Publication types