. 2009 May;10(5):531-9.
doi: 10.1038/ni.1723. Epub 2009 Apr 6.

T cell antigen receptor signaling and immunological synapse stability require myosin IIA

Affiliations

T cell antigen receptor signaling and immunological synapse stability require myosin IIA

Tal Ilani et al. Nat Immunol. 2009 May.

Abstract

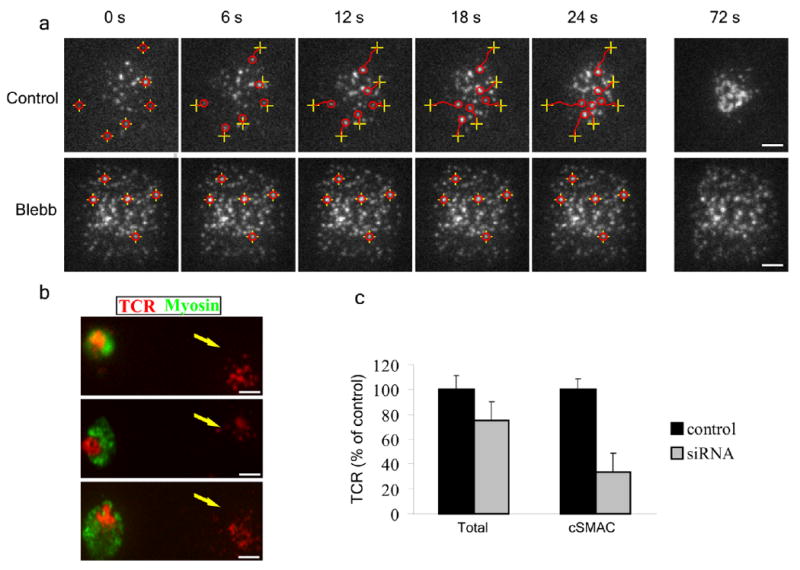
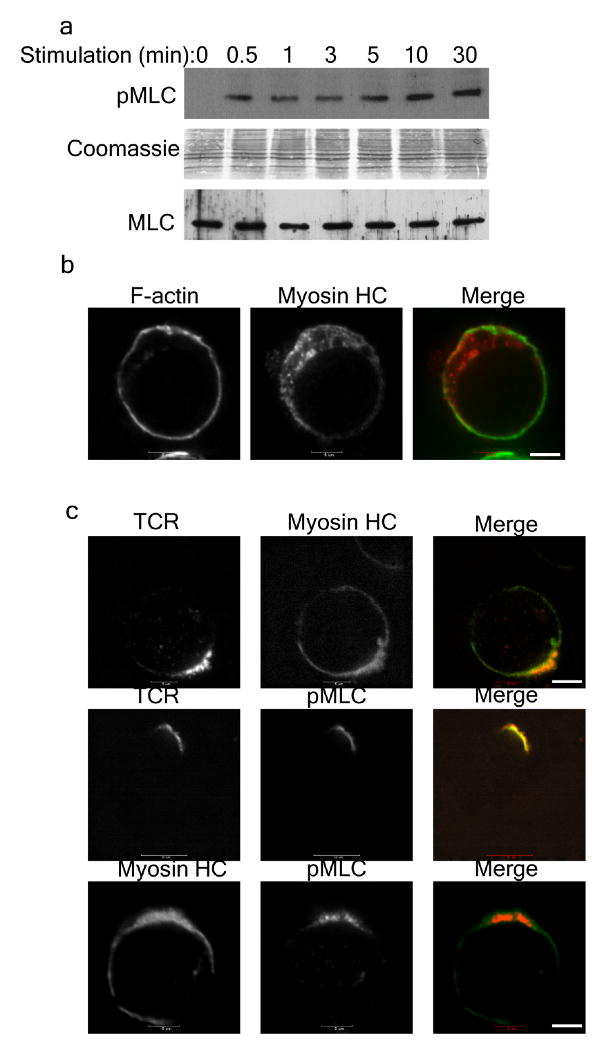
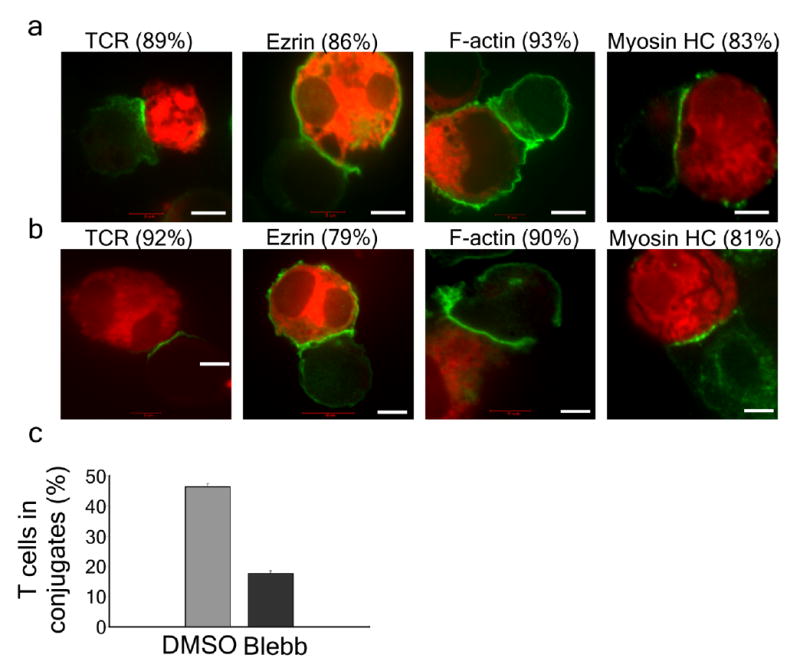
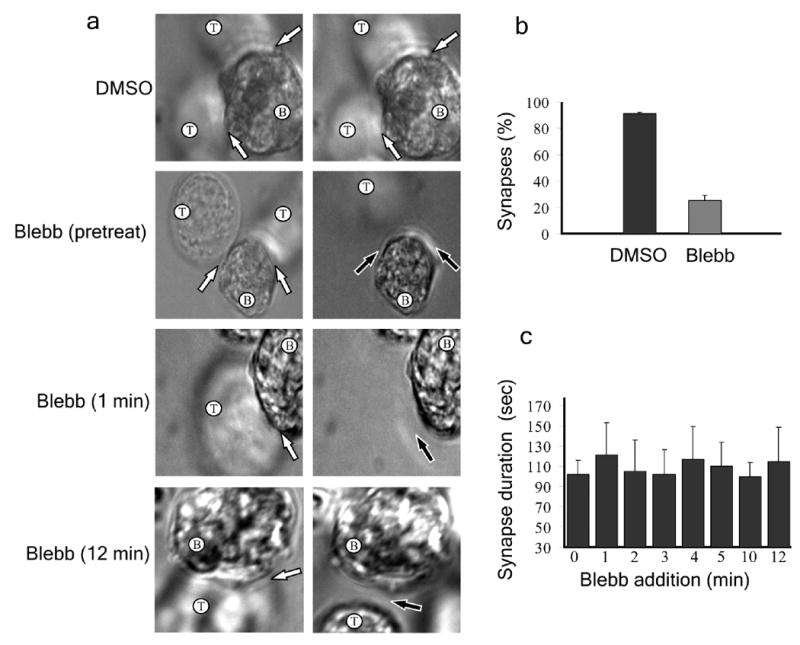
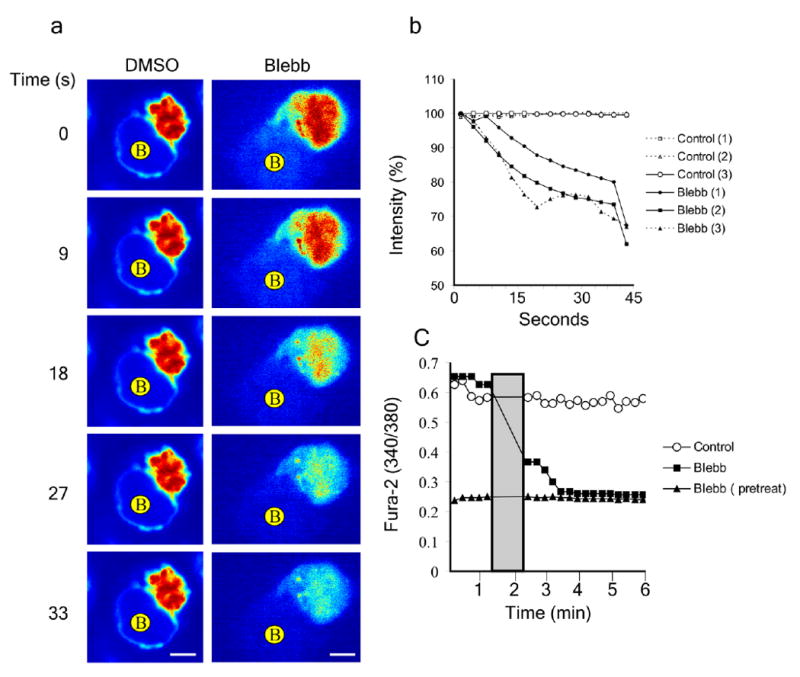
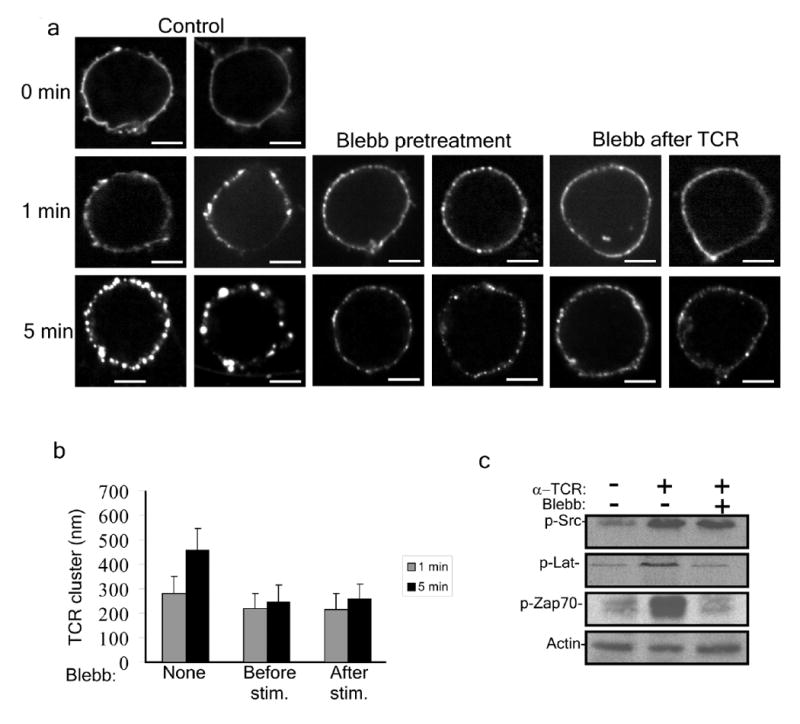
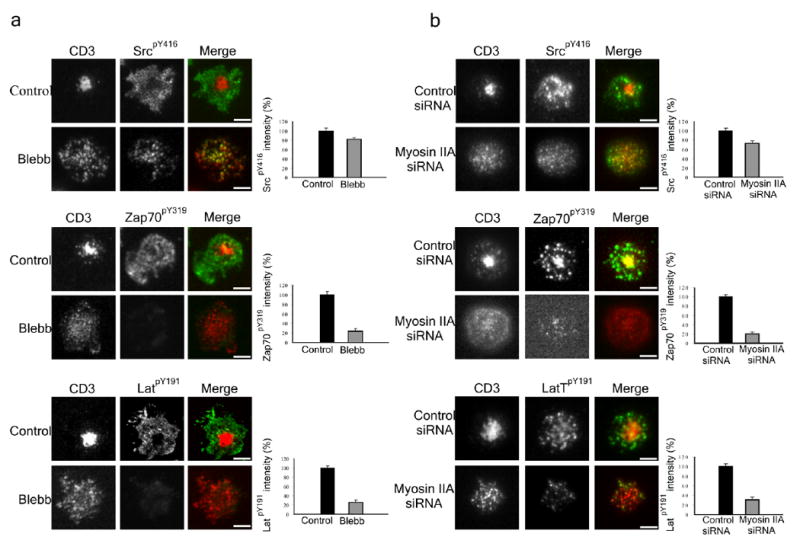
Immunological synapses are initiated by signaling in discrete T cell antigen receptor microclusters and are important for the differentiation and effector functions of T cells. Synapse formation involves the orchestrated movement of microclusters toward the center of the contact area with the antigen-presenting cell. Microcluster movement is associated with centripetal actin flow, but the function of motor proteins is unknown. Here we show that myosin IIA was necessary for complete assembly and movement of T cell antigen receptor microclusters. In the absence of myosin IIA or its ATPase activity, T cell signaling was interrupted 'downstream' of the kinase Lck and the synapse was destabilized. Thus, T cell antigen receptor signaling and the subsequent formation of immunological synapses are active processes dependent on myosin IIA.


Figures

Figure 1
Figure 1
Effect of inhibiting or depleting myosin IIA on the centripetal motion of TCR microclusters. (a) Jurkat T cells were added to a planer lipid bilayer containing Alexa-568 labeled TCR antibody and ICAM-1, and imaged during the initial min of synapse formation by TIRF microscopy. Specific microclusters from control cells (top) or blebbistatin pretreated cells (bottom) were tracked over time. Initial microcluster localization is denoted by yellow crosses, and microcluster localization at each time point is denoted by a red circle. The tracks followed by individual clusters are indicated by red lines. (b) Primary human CD4+ cells treated with siRNA constructs specific for MYH9 were added to a planer lipid bilayer containing Alexa-568 labeled TCR antibody (red) and ICAM1 for 20 min then fixed and stained for myosin IIA (green). Each panel shows one knock-down cell and one non-knock-down cell for comparison. Myosin IIA-depleted cells are denoted by an arrow. (a,b) At least 26 samples were scored per condition, scale bars: 5 μm. (c) Quantitative representation of total TCR and TCR at the center on the contact area (cSMAC) in control and myosin IIA depleted cells. n = 30.
Figure 2
Figure 2
Myosin IIA phosphorylation and redistribution during activation of T cells. (a) Abundance of phosphorylated MLC (pMLC) and total MLC (MLC) was compared in total T cell lysates at various times during activation by soluble TCR antibody (OKT3). (b) Resting Jurkat T cells were fixed and stained for F-actin (green) and myosin IIA heavy chain (HC) (red). (c) Jurkat T cells were stimulated for 1 min with OKT3 then fixed and stained for TCR, myosin HC and pMLC. Scale bars: 5μm. Percentage of cells showing colocalization is 83% for TCR and myosin IIA heavy chain (HC), 92% for TCR and pMLC and 90% for myosin IIA heavy chain (HC) and pMLC. n = 30.
Figure 3
Figure 3
Effect of inhibiting myosin IIA activity on immunological synapse formation. (a) Jurkat T cells were pretreated with DMSO for 10 min followed by 5 min incubation with SEE superantigen-loaded B cells that were prestained with CMTPX (red). Cells were fixed and stained for TCR, ezrin, F-actin or myosin-II heavy chain (green). Numbers represent percentage of cells with similar protein distribution scored in 30 cells. (b) As in a except that cells were pretreated with 50 μM blebbistatin for 10 min. Scale bars: 5 μm. (c) Quantification of the number of immunological synapses that were present after the treatment as in a,b. n = 50. Error bars indicate standard deviation.
Figure 4
Figure 4
Effect of inhibiting myosin IIA activity on immunological synapse stability. (a) SEE superantigen-loaded B cells were immobilized in dishes with coverslip inserts and Jurkat T cells were added and allowed to form immunological synapses. T cells were either pretreated with DMSO or blebbistatin or were treated with blebbistatin following synapse formation at the indicated times. DIC images were taken before treatment (left) and between 1–2 min after treatment (right). T and B cells are indicated; immunological synapses are denoted by white arrows and loss of synapse is denoted by black arrow. (b) Percentage of synapses present 2 minutes after blebbistatin addition. (c) Average duration of conjugates when blebbistatin was added at various times after synapse formation. (b,c) n = 35. Error bars indicate standard deviation.
Figure 5
Figure 5
Effect of inhibiting myosin IIA activity on intracellular Ca2+ concentration. (a) Jurkat T cells were incubated with the cytoplasmic Ca2+ sensitive dye Fluo-LOJO and then mixed with SEE superantigen-loaded B cells and allowed to form immunological synapses. Following synapse formation DMSO or blebbistatin was added and Fluo-LOJO emission intensity was imaged for the indicated times. B cells are indicated. Scale bar: 5 μm. (b) Changes in intensity over time of Ca2+ sensitive dye in three representative DMSO and blebbistatin treated cells. Treatment was added at time 0 and 100% intensity on the y-axis is the average sustain signal in superantigen activated cells. (c) Jurkat T cells were incubated with the ratiometric cytoplasmic Ca2+ dye, Fura-2-AM, then added to a planer lipid bilayer containing TCR antibody and ICAM-1 for 15 min prior to cell imaging. 340/380 absorbance ratios were determined by fluorescence microscopy every 15 s. Addition of blebbistatin or DMSO is indicated as a gray bar. Intensity ratios over time for control cells (with DMSO added), blebbistatin treated cells or cells pretreated with blebbistatin were averaged for 17 cells in 2 independent experiments. The low and high calcium ratios corresponding to cells in EGTA Mg2+ (+) Ca2+ (-) or ionomycin were also determined using buffers, respectively.
Figure 6
Figure 6
The effect of inhibiting myosin IIA activity on TCR microclusters. (a) Jurkat T cells were stimulated with Alexa-Fluor 488 anti-CD3 (control), or pretreated with 50 μM blebbistatin for 10 min (Blebb pretreatment) or 50μM blebbistatin was added after TCR stimulation at indicated times (Blebb after TCR). Cells were imaged immediately, or 1 and 5 min after stimulation. Two representative cells are shown for each time point. Scale bars: 5μm. (b) Quantitative analysis of experiments depicted in a (n = 35 clusters for each bar). (c) A representative Immunoblot analysis of 3 independent experiments of SrcpY416, ZAP70pY319 and LATpY191 in Jurkat T cells treated with OKT3 for 2 min without, or with, blebbistatin pretreatment. Actin protein abundance is shown as a loading control.
Figure 7
Figure 7
The effect of inhibiting or depleting myosin-II on signaling in T cells. (a) Control or blebbistatin pretreated Jurkat T cells were added to a planer lipid bilayer containing Alexa-568 labeled TCR antibody and ICAM1 for 25 min. Cells were then fixed and stained with antibodies against SrcpY416, ZAP70pY319 and LATpY191. Quantitative representation of relative protein phosphorylation is depicted on the right (n = 15 cells for each bar and error bars indicate standard deviation). (b) Primary human CD4+ cells treated with siRNA constructs either specific or non-specific for MYH9 gene were added to a planer lipid bilayer containing Alexa-568 labeled TCR antibody and ICAM-1 for 25 min. Cells were then fixed and stained with antibodies against SrcpY416, ZAP70pY319 and LATpY191. Myosin IIA depleted cells were determined by the lack of central TCR clustering as demonstrated in Fig. 6b. Quantitative representation of relative protein phosphorylation is depicted on the right (n = 15 cells for each bar).

References

    1. Davis MM. The alphabeta T cell repertoire comes into focus. Immunity. 2007;27:179–80. - PubMed
    1. DeMond AL, Mossman KD, Starr T, Dustin ML, Groves JT. T cell receptor microcluster transport through molecular mazes reveals mechanism of translocation. Biophys J. 2008;94:3286–92. - PMC - PubMed
    1. Monks CR, Freiberg BA, Kupfer H, Sciaky N, Kupfer A. Three-dimensional segregation of supramolecular activation clusters in T cells. Nature. 1998;395:82–6. - PubMed
    1. Dustin ML, et al. A novel adaptor protein orchestrates receptor patterning and cytoskeletal polarity in T-cell contacts. Cell. 1998;94:667–77. - PubMed
    1. Grakoui A, et al. The immunological synapse: a molecular machine controlling T cell activation. Science. 1999;285:221–7. - PubMed

Publication types

MeSH terms

Substances