. 2009 May;10(5):471-9.
doi: 10.1038/ni.1722. Epub 2009 Apr 6.

A Crohn's disease-associated NOD2 mutation suppresses transcription of human IL10 by inhibiting activity of the nuclear ribonucleoprotein hnRNP-A1

Affiliations

A Crohn's disease-associated NOD2 mutation suppresses transcription of human IL10 by inhibiting activity of the nuclear ribonucleoprotein hnRNP-A1

Eiichiro Noguchi et al. Nat Immunol. 2009 May.

Abstract

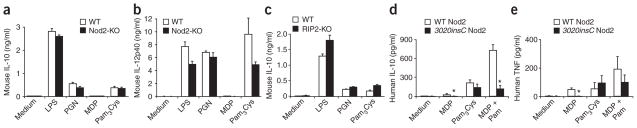
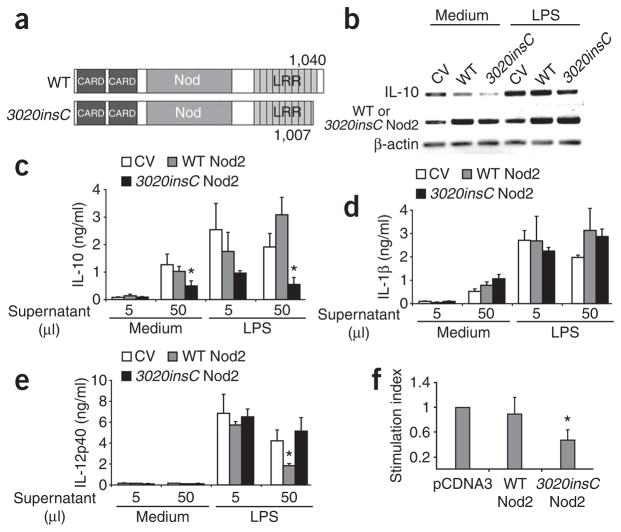
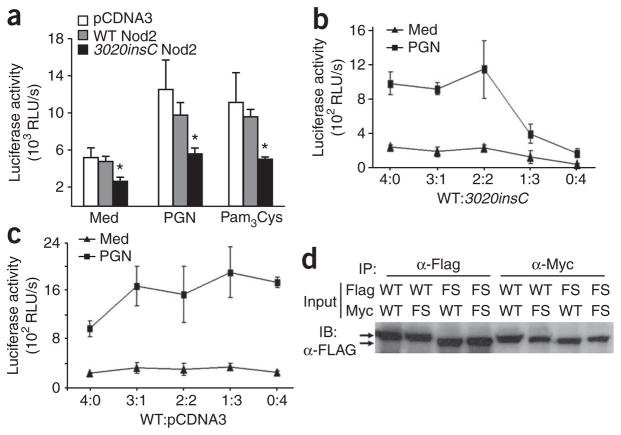
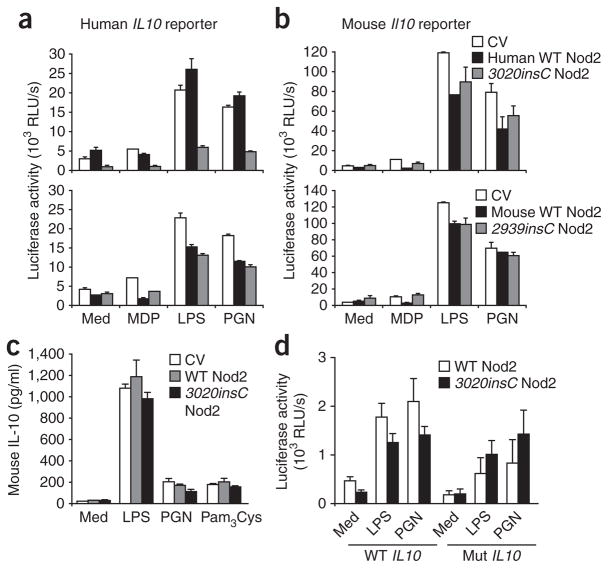
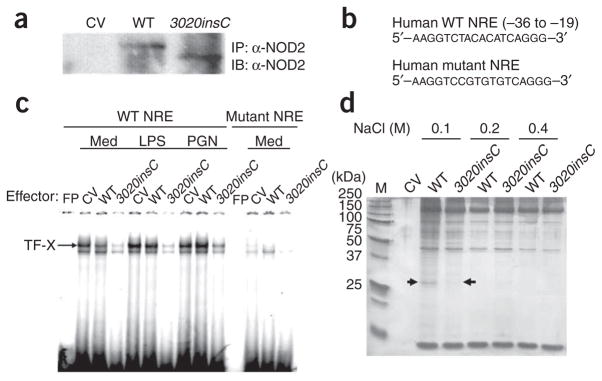
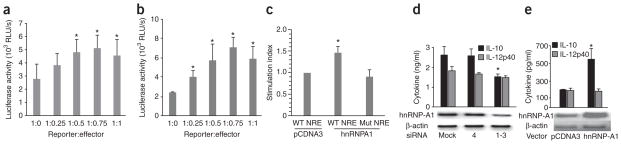
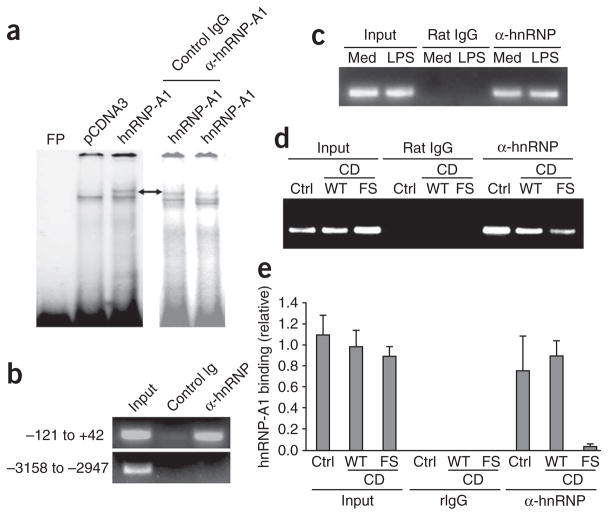
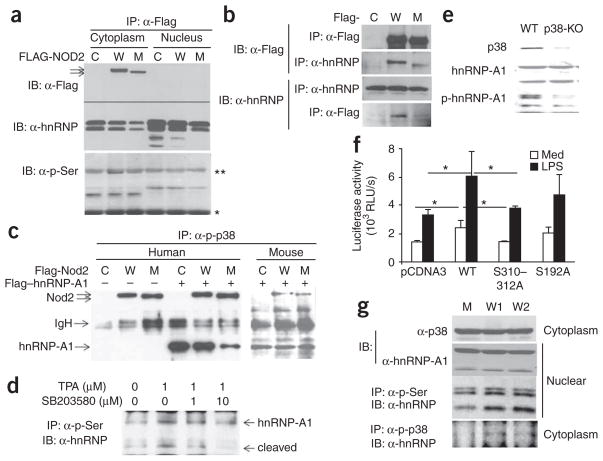
A common mutation in the gene encoding the cytoplasmic sensor Nod2, involving a frameshift insertion at nucleotide 3020 (3020insC), is strongly associated with Crohn's disease. How 3020insC contributes to this disease is a controversial issue. Clinical studies have identified defective production of interleukin 10 (IL-10) in patients with Crohn's disease who bear the 3020insC mutation, which suggests that 3020insC may be a loss-of-function mutation. However, here we found that 3020insC Nod2 mutant protein actively inhibited IL10 transcription. The 3020insC Nod2 mutant suppressed IL10 transcription by blocking phosphorylation of the nuclear ribonucleoprotein hnRNP-A1 via the mitogen-activated protein kinase p38. We confirmed impairment in phosphorylation of hnRNP-A1 and binding of hnRNP-A1 to the IL10 locus in peripheral blood mononuclear cells from patients with Crohn's disease who bear the 3020insC mutation and have lower production of IL-10.


Figures

Figure 1
Figure 1
Influence of Nod2 signaling on macrophage cytokine production. (ac) ELISA of mouse IL-10 (a,c) and IL-12p40 (b) in supernatants of wild-type (WT), Nod2−/− (Nod2-KO) and Ripk2−/− (RIP2-deficient; RIP2-KO) mouse BMDMs stimulated for 24 h in vitro with medium, LPS (1 μg/ml), peptidoglycan (PGN; 10 μg/ml), muramyl dipeptide (MDP; 10 μg/ml) or Pam3Cys (1 μg/ml); results are normalized to total cellular protein. Data represent three independent experiments (error bars, s.e.m.). (d,e) ELISA of human IL-10 (d) and tumor necrosis factor (e) in supernatants of monocytes obtained from healthy people expressing wild-type Nod2 (n = 9) and patients with Crohn’s disease who were homozygous for 3020insC (n = 5) and then stimulated for 24 h with medium, muramyl dipeptide, Pam3Cys or a combination of muramyl dipeptide and Pam3Cys (MDP + Pam); results are normalized to total cellular protein. *, P < 0.05. Data are representative of one experiment with each donor sample measured in triplicate (error bars, s.d.).
Figure 2
Figure 2
Different effects of wild-type and 3020insC Nod2 on endogenous IL-10 expression in primary human monocytes. (a) Wild-type and 3020insC Nod2 constructs. CARD, caspase-recruitment domain. (b) RT-PCR analysis of the expression of mRNA encoding IL-10, Nod2 and β-actin by primary human monocytes transduced for 4 d with empty control vector (CV) or lentivirus encoding wild-type or 3020insC Nod2 and then stimulated for 5 d with medium or LPS. On the basis of lentiviral expression of green fluore-scent protein, an average infection rate of 38% was achieved. ‘Background’ bands represent endogenous Nod2 mRNA in infected cells. (ce) ELISA of the secretion of IL-10 (c), IL-1β (d) and IL-12p40 (e) by human monocytes infected with 5 or 50 μl lentivirus-containing supernatant (key) and treated with medium or LPS, analyzed on day 5 after infection and normalized to cytokine produced (pg/ml) per 1 ×10⁵ live cells. *, P < 0.03. (f) Luciferase activity in lysates of primary human monocytes transfected for 6 h with a human IL10 promoter–luciferase reporter, together with empty vector (pCDNA3) or vector encoding wild-type or 3020insC Nod2 constructs (optimized response); results are presented as the stimulation index, derived from the ratio of the luciferase activity in each experimental condition to that of cells transfected with empty vector. Mean transfection efficiency, 35%. Data are representative of three experiments with one donor each (error bars (cf), s.d.).
Figure 3
Figure 3
Inhibition of IL10 transcription by 3020insC Nod2. (a) Luciferase activity of lysates of RAW264.7 cells transfected for 1 d with the human IL10 promoter–lucifersase reporter together with empty vector (pCDNA3) or vector encoding wild-type or 3020insC Nod2 at an effector/reporter molar ratio of 0.3:1, then stimulated for 24 h with medium (Med), peptidoglycan or Pam3Cys. RLU, raw luciferase units. Expression of the transfected Nod2 and 3020insC mutant in RAW264.7 cells was verified by RT-PCR with primers selective for human but not mouse Nod2 (Supplementary Fig. 1). (b,c) Luciferase activity in lysates of cells transfected for 1 d with the human IL10 promoter–luciferase reporter, together with various molar ratios (horizontal axes) of vectors encoding wild-type and 3020insC Nod2 (b) or wild-type Nod2 and empty vector (pCDNA3; c), then stimulated for 7 h with medium or peptidoglycan. Reporter amount remained constant, set as 1. (d) Immunoassay of extracts of HEK293T cells transfected for 24 h (Input) with Flag- or Myc-tagged wild-type Nod2 (WT) or 3020insC Nod2 (frameshift (FS)), then immunoprecipitated (IP) with anti-Flag (α-Flag) or anti-c-Myc (α-Myc) and analyzed by immunoblot (IB) with anti-Flag. Arrows indicate that 3020insC Nod2 is smaller than wild-type Nod2. Data represent the pooled results of at least three independent experiments (error bars (ac), s.d.).
Figure 4
Figure 4
Human and mouse Nod2 mutant proteins have different transcriptional effects. (a,b) Luciferase activity in lysates of RAW264.7 cells transfected for 1 d with a human IL10 promoter–luciferase reporter (a) or a mouse Il10 promoter–luciferase reporter (b) together with empty control vector or vector expressing human wild-type or 3020insC Nod2 (top) or mouse wild-type or 2939insC Nod2 (bottom) at a reporter/effector molar ratio of 1:1, then stimulated for 24 h with medium, muramyl dipeptide, LPS or peptidoglycan. *, P < 0.03. Data represent three to four independent experiments (mean and s.d.). (c) ELISA of mouse IL-10 in supernatants of Nod2−/− BMDMs infected twice with empty control vector (CV) or retrovirus encoding wild-type or 3020insC Nod2 and then, on day 5 after infection, stimulated for 24 h with medium, LPS, peptidoglycan or Pam3Cys. Equivalent expression of transduced human wild-type and 3020insC Nod2 mRNA in unstimulated Nod2−/− BMDMs was ensured (Supplementary Fig. 3 online). Data are representative of three experiments with one mouse each (error bars, s.d. of triplicate samples). (d) Luciferase activity in lysates of RAW264.7 cells transiently transfected with constructs encoding wild-type or 3020insC Nod2 (key) plus luciferase reporter constructs driven by the IL10 promoter fragment (positions −782 to +12) with (Mut IL10) or without (WT IL10) point mutations in the region between positions −30 and −25 and then stimulated for 7 h with medium, LPS or peptidoglycan. Data are representative of four individual experiments (mean and s.d.).
Figure 5
Figure 5
Binding of nuclear proteins to the NRE. (a) Immunoassay of lysates of RAW264.7 cells stably transfected with empty vector or vector encoding wild-type or 3020insC Nod2, then immunoprecipitated and analyzed by immunoblot with anti-Nod2. Results are representative of more than five separate experiments. (b) Sequences of probes used for EMSA. The mutant NRE probe bears the same mutations as those between positions −30 and −25 in the IL10 promoter mutant construct in Figure 4d. (c) EMSA (with the probes in b) of nuclear extracts of the stable RAW264.7 transfectants in a, stimulated with medium, LPS or peptidoglycan. FP, free probe. Results are representative of four separate experiments. (d) DNA precipitation of nuclear extracts of the stable RAW264.7 transfectants in a with biotinylated oligonucleotides encompassing the IL10 NRE, followed by elution at increasing NaCl concentrations (above gel), separation by 12% SDS-PAGE and silver staining. Arrows indicated bands that were excised and analyzed. M, molecular size markers (in kilodaltons (kDa)). Results are representative of three independent experiments with identical results.
Figure 6
Figure 6
Stimulation of IL10 transcription by hnRNP-A1. (a,b) Luciferase activity of RAW264.7 cells transfected for 48 h with a human (a) or mouse (b) IL-10 reporter together with pCDNA3 and/or mouse hnRNP-A1 at various reporter/effector ratios (horizontal axes). (c) Luciferase activity of RAW264.7 cells transfected with reporter constructs driven by a wild-type (WT NRE) or mutant (Mut NRE) IL10 NRE, together with empty vector (pcDNA3) or vector encoding mouse hnRNP-A1, presented relative to that in pCDNA3-transfected cells. (d) ELISA of IL-10 and IL-12p40 in supernatants of primary human monocytes transfected with siRNA specific for hnRNP-A1 (4 and 1–3) or mock transfected (Mock; d) or transfected with with empty vector (pCDNA3) or expression vector encoding hnRNP-A1 (e), then, 6 h after transfection, stimulated for 12 h with LPS. Below, RT-PCR analysis of the expression of hnRNP-A1 and β-actin mRNA demonstrates the efficiency of siRNA-mediated knockdown (d) or vector transfection (e). *, P < 0.05. Data represent from three to five independent experiments (mean and s.d.).
Figure 7
Figure 7
Binding of hnRNP-A1 to the IL10 NRE. (a) EMSA of nuclear extracts of RAW264.7 cells stably transfected with empty vector (pCDNA3) or vector encoding hnRNP-A1, analyzed with a probe containing wild-type IL10 NRE. Right, extracts incubated with anti-hnRNP-A1 or control immunoglobulin (IgG) before incubation with probe. Results are representative of three independent experiments. (b) ChIP of primary human monocytes with anti-hnRNP-A1 or control immunoglobulin (Ig), followed by PCR amplification of IL10 promoter regions between positions −121 and +42 (top) or positions −3158 and −2947 (bottom) in input DNA or DNA extracted from immunoprecipitates. Results are representative of three separate experiments. (c) ChIP of unstimulated (Med) and LPS-stimulated (LPS) primary human monocytes, followed by PCR amplification of the IL10 promoter region between positions −121 and +42. Rat IgG serves as a control. Results are representative of three separate experiments. (d) ChIP analysis of unstimulated human PBMCs from healthy control subjects (Ctrl) or patients with Crohn’s disease (CD) with wild-type NOD2 (WT) or homozygous for the 3020insC mutation (FS). Results are from one representative of three experiments. (e) Real-time quantitative PCR analysis of the binding of hnRNP-A1 in each sample in d. Results for immunoprecipitated DNA are presented relative to those for genomic input DNA. Data are representative of experiments done in triplicate (mean and s.d. of three donors per group).
Figure 8
Figure 8
Nod2–hnRNP-A1 interaction and phosphorylation of hnRNP-A1 by p38. (a) Immunoassay of HEK293 cells transiently transfected for 1 d with empty vector (C) or with vector encoding Flag-tagged wild-type (W) or 3020insC (M) Nod2, together with vector encoding Flag-tagged hnRNP-A1, followed by immunoprecipitation of cytoplasmic and nuclear extracts with anti-Flag and immunoblot analysis with anti-Flag, anti-hnRNP-A1 (α-hnRNP) and antibody to phosphorylated serine (α-p-Ser). **, immunoglobulin heavy chain; *, immunoglobulin light chain. (b) Immunoassay of HEK293 cells transiently transfected for 1 d with the Flag-tagged constructs described in a, followed by immunoprecipitation and immunoblot analysis of whole-cell lysates with anti-Flag or anti-hnRNP-A1. (c) Immunoassay of HEK293 cells transfected with human wild-type Nod2 (W) or 3020insC Nod2 (M; left) or with mouse wild-type Nod2 (W) or 2939insC Nod2 (M; right), followed by immunoprecipitation of whole-cell lysates with antibody to serine-phosphorylated p38 (α-p-p38) and immunoblot analysis with anti-Flag. (d) Immunoassay of HEK293 cells treated for 60 min with the p38 inhibitor SB203580, followed by the addition of TPA (12-O-tetradecanoylphorbol-1,3-acetate) for 30 min (concentrations, above lanes) and immunoprecipitation and immunoblot analysis of nuclear extracts. Results in ad represent at least three independent experiments. (e) Immunoblot analysis of whole-cell lysates of BMDMs obtained from wild-type mice (WT; n = 3) and p38α-deficient mice (p38-KO; n = 3) and then stimulated with LPS. Results are representative of two separate experiments. (f) Luciferase activity of lysates of RAW264.7 cells transfected with the human IL10 promoter–luciferase reporter together with empty vector (pCDNA3) or vector encoding wild-type, S310312A or S192A hnRNP-A1, then stimulated for 24 h with medium or LPS. *, P < 0.03. Data represent three independent experiments (mean and s.d.). (g) Immunoprecipitation and immunoblot analysis of cytoplasmic and nuclear extracts of PBMCs isolated from patients with Crohn’s disease homozygous for 3020insC (M; n = 4) or expressing wild-type Nod2 (W1; n = 4) and healthy people expressing wild-type Nod2 (W2; n = 6). Results are representative of one experiment.

Comment in

References

    1. Podolsky DK. Inflammatory bowel disease. N Engl J Med. 2002;347:417–429. - PubMed
    1. Fuss IJ, Boirivant M, Lacy B, Strober W. The interrelated roles of TGF-β and IL-10 in the regulation of experimental colitis. J Immunol. 2002;168:900–908. - PubMed
    1. Inohara N, Nunez G. NODs: intracellular proteins involved in inflammation and apoptosis. Nat Rev Immunol. 2003;3:371–382. - PubMed
    1. Girardin SE, et al. Nod1 detects a unique muropeptide from gram-negative bacterial peptidoglycan. Science. 2003;300:1584–1587. - PubMed
    1. Girardin SE, et al. Nod2 is a general sensor of peptidoglycan through muramyl dipeptide (MDP) detection. J Biol Chem. 2003;278:8869–8872. - PubMed

Publication types

MeSH terms

Substances