Comparative Study
. 2009 Aug;38(8):761-9.
doi: 10.1007/s00256-009-0683-0. Epub 2009 Apr 7.

Comparative study of imaging at 3.0 T versus 1.5 T of the knee

Affiliations
Comparative Study

Comparative study of imaging at 3.0 T versus 1.5 T of the knee

Scott Wong et al. Skeletal Radiol. 2009 Aug.

Abstract

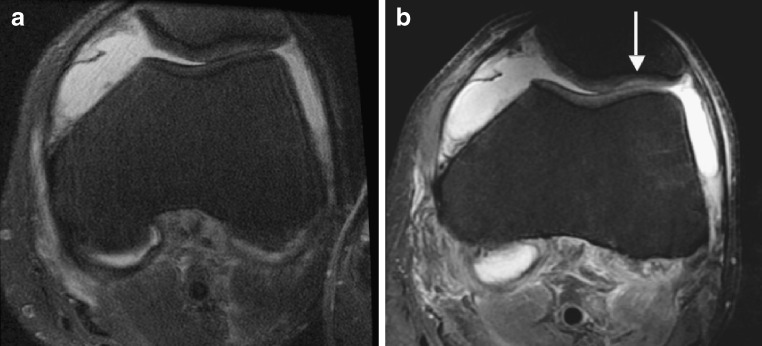
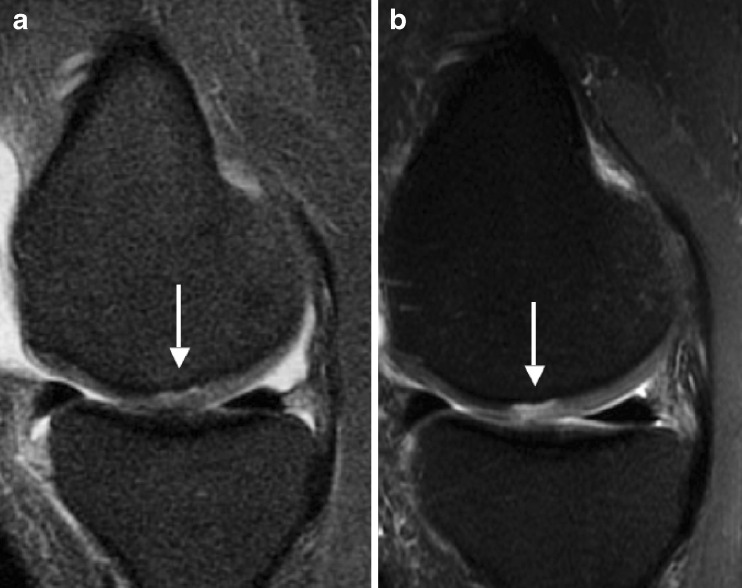
Purpose: The objectives of the study were to compare MR imaging at 1.5 and 3.0 T in the same patients concerning image quality and visualization of cartilage pathology and to assess diagnostic performance using arthroscopy as a standard of reference.

Materials and methods: Twenty-six patients were identified retrospectively as having comparative 1.5 and 3.0 T MR studies of the knee within an average of 102 days. Standard protocols included T1-weighted and fat-saturated intermediate-weighted fast spin-echo sequences in three planes; sequence parameters had been adjusted to account for differences in relaxation at 3.0 T. Arthroscopy was performed in 19 patients. Four radiologists reviewed each study independently, scored image quality, and analyzed pathological findings. Sensitivities, specificities, and accuracies in diagnosing cartilage lesions were calculated in the 19 patients with arthroscopy, and differences between 1.5 and 3.0 T exams were compared using paired Student's t tests with a significance threshold of p < 0.05.

Results: Each radiologist scored the 3.0 T studies higher than those obtained at 1.5 T in visualizing anatomical structures and abnormalities (p < 0.05). Using arthroscopy as a standard of reference, diagnosis of cartilage abnormalities was improved at 3.0 T with higher sensitivity (75.7% versus 70.6%), accuracy (88.2% versus 86.4%), and correct grading of cartilage lesions (51.3% versus 42.9%). Diagnostic confidence scores were higher at 3.0 than 1.5 T (p < 0.05) and signal-to-noise ratio at 3.0 T was approximately twofold higher than at 1.5 T.

Conclusion: MRI at 3.0 T improved visualization of anatomical structures and improved diagnostic confidence compared to 1.5 T. This resulted in significantly better sensitivity and grading of cartilage lesions at the knee.


Figures

Fig. 1
Fig. 1
A 35-year-old male patient reported locking and painful left knee. a The 1.5 T study (sagittal fs iw FSE sequence, TR 3,200 ms, TE 46 ms) with questionable signal change at the patellar cartilage (arrow). b The corresponding sequence obtained at 3.0 T (TR 4,300 ms, TE 51 ms; arrow), in which the radiologists correctly identified a definite greater than 50% patellar cartilage lesion. Arthroscopy served as a standard of reference
Fig. 2
Fig. 2
A 37-year-old male patient presented with swelling and contracture of the left knee. While no definite lesion was visualized at 1.5 T (a; axial fs iw FSE sequence, TR 3,700 ms, TE 46 ms), a patellar cartilage lesion (arrow) was correctly demonstrated and graded (>50%) on the corresponding FSE sequence (TR 4,300 ms, TE 51 ms) at 3.0 T (b; arrow), as verified by arthroscopy
Fig. 3
Fig. 3
A 36-year-old male patient with a clinical history of left knee pain and suspected osteochondritis dissecans. At 1.5 T (a; sagittal fs iw FSE sequence, TR 3,200 ms, TE 46 ms) an area of high signal is shown along the subchondral bone underneath the cartilage suggesting delamination (arrow) without a focal cartilage defect. The 3.0 T study (a; TR 4,300 ms, TE 51 ms) clearly shows a full thickness cartilage defect along with delamination (arrow). Findings were confirmed by arthroscopy after both imaging studies were obtained
Fig. 4
Fig. 4
A 28-year-old woman reported right knee pain with suspected meniscal tear. The coronal fs iw FSE sequence (TR 3,200 ms, TE 46 ms) at 1.5 T (a) shows a probable less than 50% lesion with additional cartilage thinning, while the corresponding 3.0 T sequence (TR 4,300 ms, TE 51 ms) demonstrates a definite less than 50% lesion (arrow)
Fig. 5
Fig. 5
A 52-year-old female patient presents with left knee pain and a history of early osteoarthritis. Comparative MRI studies and arthroscopy were obtained. A horizontal tear of the posterior horn of the medial meniscus is demonstrated at 3.0 T (confidence score 3; b; TR 4,300 ms, TE 51 ms; arrow), which is not well shown at 1.5 T (confidence score 1–2; TR 3,200 ms, TE 46 ms; arrow)

References

    1. De Smet AA, Mukherjee R. Clinical, MRI, and arthroscopic findings associated with failure to diagnose a lateral meniscal tear on knee MRI. AJR Am J Roentgenol. 2008;190:22–26. doi: 10.2214/AJR.07.2611. - DOI - PubMed
    1. Huysse WC, Verstraete KL. Health technology assessment of magnetic resonance imaging of the knee. Eur J Radiol. 2008;65:190–193. doi: 10.1016/j.ejrad.2007.11.011. - DOI - PubMed
    1. Link TM, Stahl R, Woertler K. Cartilage imaging: motivation, techniques, current and future significance. Eur Radiol. 2007;17:1135–1146. doi: 10.1007/s00330-006-0453-5. - DOI - PubMed
    1. Craig JG, Go L, Blechinger J, et al. Three-tesla imaging of the knee: initial experience. Skeletal Radiol. 2005;34:453–461. doi: 10.1007/s00256-005-0919-6. - DOI - PubMed
    1. Shapiro MD, Magee T, Williams D, Ramnath R, Ross JS. The time for 3 T clinical imaging is now. AJNR Am J Neuroradiol. 2004;25:1628–1629. - PMC - PubMed