. 2009 Nov;30(11):3527-40.
doi: 10.1002/hbm.20776.

Visuo-attentional and sensorimotor alpha rhythms are related to visuo-motor performance in athletes

Affiliations

Visuo-attentional and sensorimotor alpha rhythms are related to visuo-motor performance in athletes

Claudio Del Percio et al. Hum Brain Mapp. 2009 Nov.

Abstract

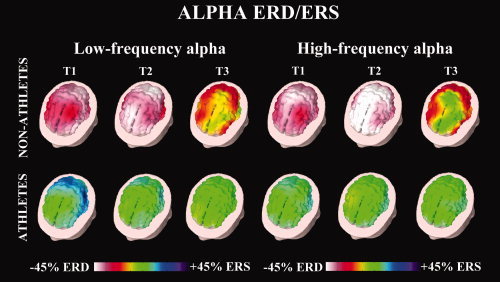
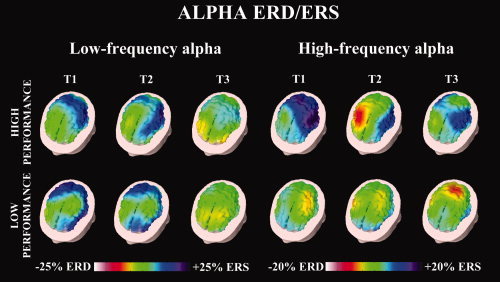
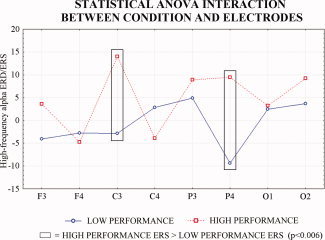
This study tested the two following hypotheses: (i) compared with non-athletes, elite athletes are characterized by a reduced cortical activation during the preparation of precise visuo-motor performance; (ii) in elite athletes, an optimal visuo-motor performance is related to a low cortical activation. To this aim, electroencephalographic (EEG; 56 channels; Be Plus EB-Neuro) data were recorded in 18 right-handed elite air pistol shooters and 10 right-handed non-athletes. All subjects performed 120 shots. The EEG data were spatially enhanced by surface Laplacian estimation. With reference to a baseline period, power decrease/increase of alpha rhythms during the preshot period indexed the cortical activation/deactivation (event-related desynchronization/synchronization, ERD/ERS). Regarding the hypothesis (i), low- (about 8-10 Hz) and high-frequency (about 10-12 Hz) alpha ERD was lower in amplitude in the elite athletes than in the non-athletes over the whole scalp. Regarding the hypothesis (ii), the elite athletes showed high-frequency alpha ERS (about 10-12 Hz) larger in amplitude for high score shots (50%) than for low score shots; this was true in right parietal and left central areas. A control analysis confirmed these results with another indicator of cortical activation (beta ERD, about 20 Hz). The control analysis also showed that the amplitude reduction of alpha ERD for the high compared with low score shots was not observed in the non-athletes. The present findings globally suggest that in elite athletes (experts), visuo-motor performance is related to a global decrease of cortical activity, as a possible index of spatially selective cortical processes ("neural efficiency").


Figures

Figure 1
Figure 1
Electroencephalographic (EEG) electrode montage. [Color figure can be viewed in the online issue, which is available at www.interscience.wiley.com.]
Figure 2
Figure 2
Topographical distribution of the low‐ and high‐frequency alpha ERD/ERS amplitude in the elite athletes and non‐athletes. The alpha ERD/ERS is mapped at three preshot periods: T1 from −3 s to −2 s with respect to zerotime (i.e. zerotime = onset of the shot), T2 from −2 s to −1 s, and T3 from −1 s to zero time. Color scale: maximum ERD and ERS are coded in white and violet, respectively. The maximal (%) value of the ERD/ERS is reported beneath the maps.
Figure 3
Figure 3
Topographical distribution of the low‐ and high‐frequency alpha ERD/ERS amplitude for the low performance and high performance conditions in elite athletes. The alpha ERD/ERS are mapped at the three following preshot periods: T1 from −3 s to −2 s with respect to the zerotime (i.e. zerotime = onset of the shot), T2 from −2 s to −1 s, and T3 from −1 s to the zerotime. Color scale: maximum ERD and ERS are coded in white and violet, respectively. The maximal (%) value of the ERD/ERS percentages is reported beneath the maps. [Color figure can be viewed in the online issue, which is available at www.interscience.wiley.com.]
Figure 4
Figure 4
Mean values of the high‐frequency alpha ERD/ERS amplitude illustrating a statistical ANOVA interaction between the factors Condition (low performance, high performance) and Electrode (F3, F4, C3, C4, P3, P4, O1, O2). The rectangles indicate the electrode sites at which alpha ERD/ERS presented statistically significant differences between conditions (Duncan post hoc testing, P < 0.05). [Color figure can be viewed in the online issue, which is available at www.interscience.wiley.com.]
Figure 5
Figure 5
Topographical distribution of the low‐ and high‐frequency alpha ERD/ERS amplitude for the low performance and high performance conditions in the non‐athletes. The alpha ERD/ERS is mapped at the three following preshot periods: T1 from −3 s to −2 s with respect to the zero time (i.e. zero time = onset of the shot), T2 from −2 s to −1 s, and T3 from −1 s to the zerotime. Color scale: maximum ERD and ERS are coded in white and violet, respectively. The maximal (%) value of the ERD/ERS percentages is reported beneath the maps. [Color figure can be viewed in the online issue, which is available at www.interscience.wiley.com.]
Figure 6
Figure 6
Mean values of the high‐frequency alpha ERD/ERS amplitude illustrating a statistical ANOVA interaction between the factors Condition (low performance, high performance), Time (T1, T2, T3), and Electrode (O1, O2). The rectangles indicate the electrode sites at which alpha ERD/ERS presented statistically significant differences between conditions (Duncan post hoc testing, P < 0.05).
Figure 7
Figure 7
Mean values of the high‐frequency alpha ERD/ERS amplitude illustrating a statistical ANOVA interaction between the factors Condition (low performance, high performance) and ROI (FL, FR, PL, C3, PL, PR, OL, OR). The rectangles indicate the ROIs where alpha ERD/ERS presented statistically significant differences between conditions (Duncan post hoc testing, P < 0.05). [Color figure can be viewed in the online issue, which is available at www.interscience.wiley.com.]
Figure 8
Figure 8
Topographical distribution of the low‐ and high‐frequency beta ERD/ERS amplitude in the elite athletes and non‐athletes. The beta ERD/ERS is mapped at the three preshot periods of interest: T1 from −3 s to −2 s with respect to zero time (i.e. zero time = onset of the shot), T2 from −2 s to −1 s, and T3 from −1 s to zero time. Color scale: maximum ERD and ERS are coded in white and violet, respectively. The maximal (%) value of ERD/ERS is reported beneath the maps. [Color figure can be viewed in the online issue, which is available at www.interscience.wiley.com.]

References

    1. Babiloni F,Babiloni C,Carducci F,Fattorini L,Onorati P,Urbano A ( 1996): Spline Laplacian estimate of EEG potentials over a realistic magnetic resonance‐constructed scalp surface model. Electroencephalogr Clin Neurophysiol 98: 363–373. - PubMed
    1. Babiloni F,Carducci F,Babiloni C,Urbano A ( 1998): Improved realistic Laplacian estimate of highly‐sampled EEG potentials by regularization techniques. Electroencephalogr Clin Neurophysiol 106: 336–343. - PubMed
    1. Babiloni C,Babiloni F,Carducci F,Cincotti F,Cocozza G,Del Percio C,Moretti DV,Rossini PM ( 2002): Human cortical EEG rhythms during the observation of simple aimless movements. A high resolution EEG study. NeuroImage 17: 559–572. - PubMed
    1. Babiloni C,Del Percio C,Babiloni F,Carducci F,Cincotti F,Moretti DV,Rossini PM ( 2003): Transient human cortical responses during the observation of simple finger movements. A high‐resolution EEG study. Hum Brain Mapp 20): 148–157. - PMC - PubMed
    1. Babiloni C,Miniussi C,Babiloni F,Carducci F,Cincotti F,Del Percio C,Sirello G,Sosta K,Nobre AC,Paolo M,Rossini PM ( 2004): Sub‐second “temporal attention” modulates alpha rhythms. A high‐resolution EEG study. Cognit Brain Res 19: 259–268. - PubMed

Publication types