Comparative Study
. 2009 Jun;8(6):2679-95.
doi: 10.1021/pr800913j.

Use of (32)P to study dynamics of the mitochondrial phosphoproteome

Affiliations
Comparative Study

Use of (32)P to study dynamics of the mitochondrial phosphoproteome

Angel M Aponte et al. J Proteome Res. 2009 Jun.

Abstract

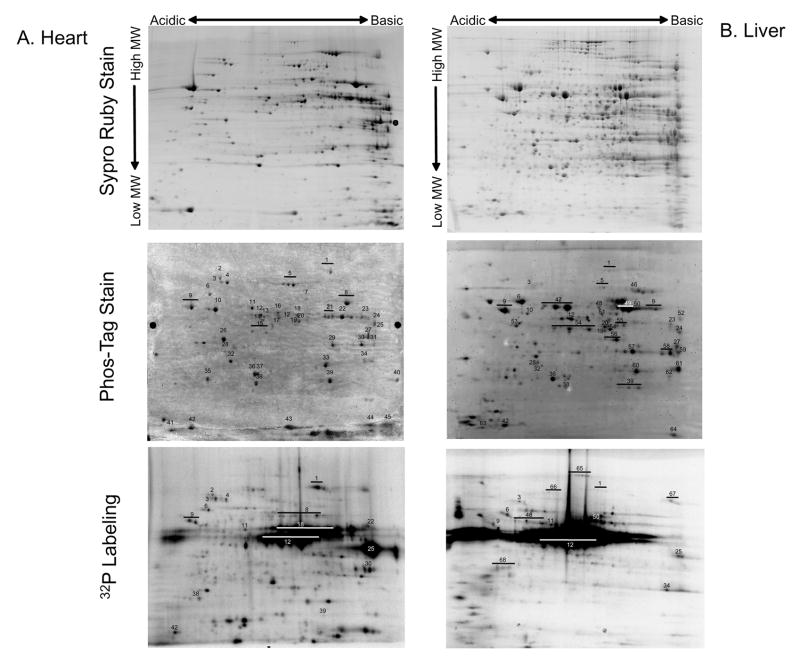
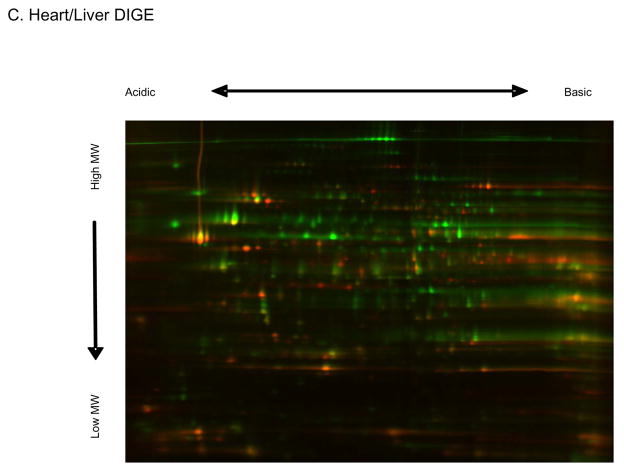
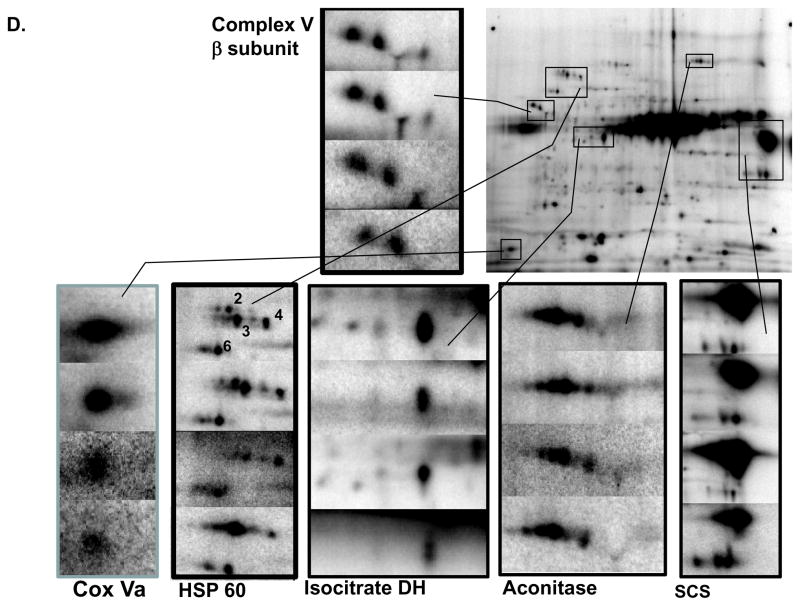
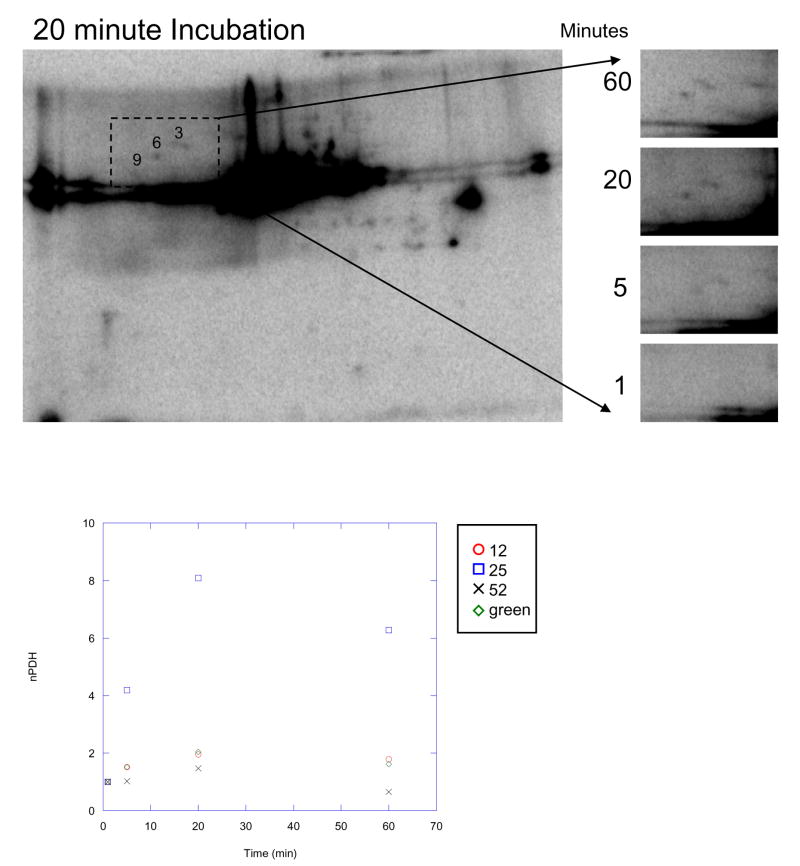
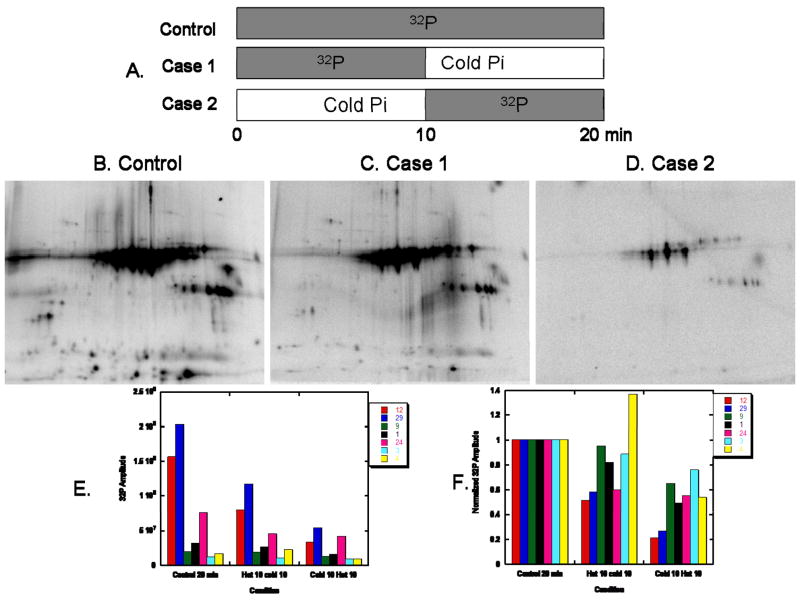
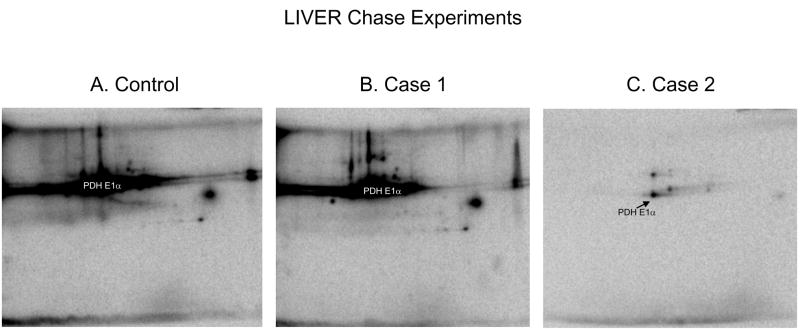
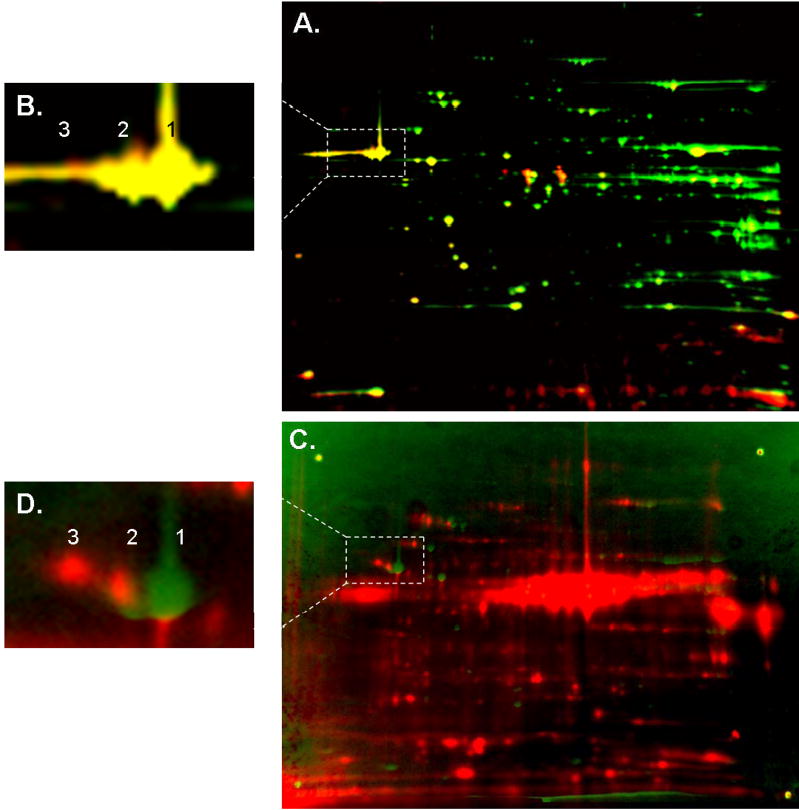
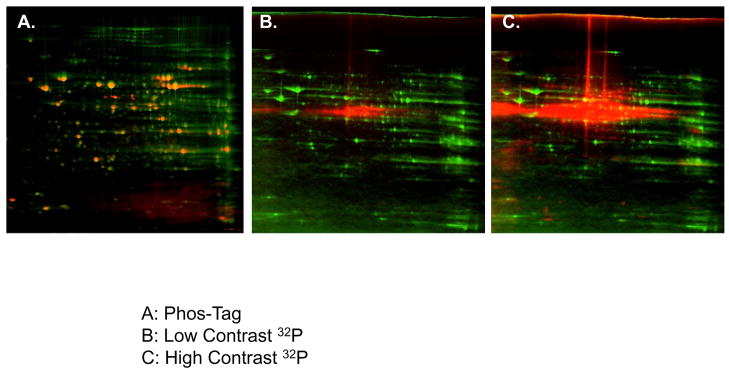
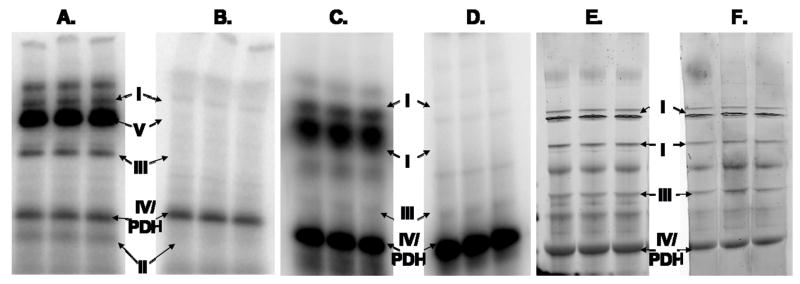
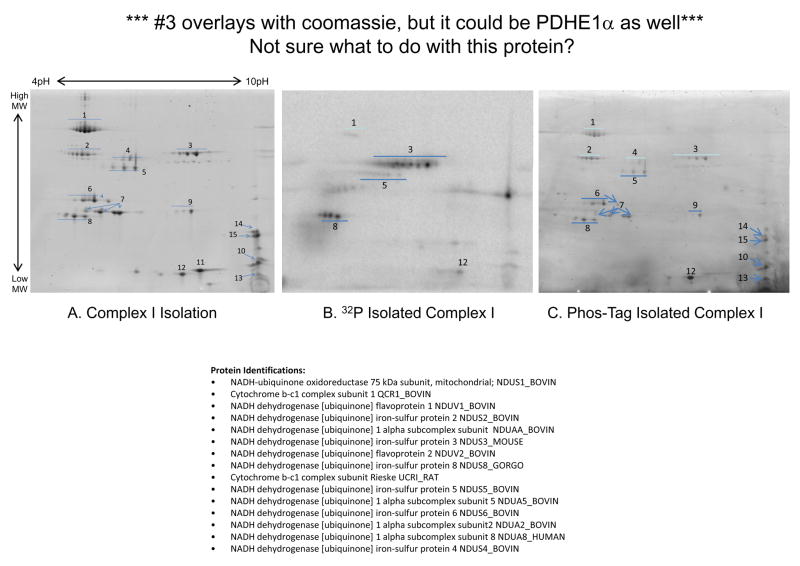
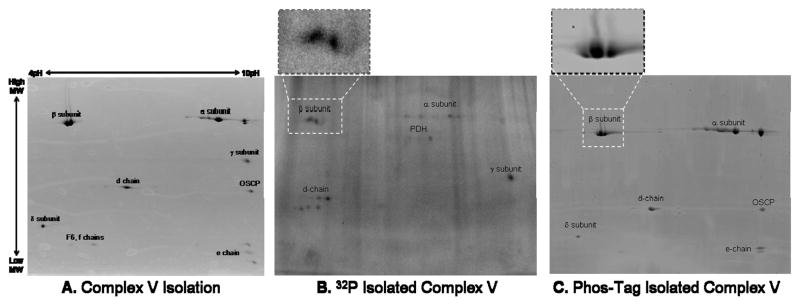
Protein phosphorylation is a well-characterized regulatory mechanism in the cytosol, but remains poorly defined in the mitochondrion. In this study, we characterized the use of (32)P-labeling to monitor the turnover of protein phosphorylation in the heart and liver mitochondria matrix. The (32)P labeling technique was compared and contrasted to Phos-tag protein phosphorylation fluorescent stain and 2D isoelectric focusing. Of the 64 proteins identified by MS spectroscopy in the Phos-Tag gels, over 20 proteins were correlated with (32)P labeling. The high sensitivity of (32)P incorporation detected proteins well below the mass spectrometry and even 2D gel protein detection limits. Phosphate-chase experiments revealed both turnover and phosphate associated protein pool size alterations dependent on initial incubation conditions. Extensive weak phosphate/phosphate metabolite interactions were observed using nondisruptive native gels, providing a novel approach to screen for potential allosteric interactions of phosphate metabolites with matrix proteins. We confirmed the phosphate associations in Complexes V and I due to their critical role in oxidative phosphorylation and to validate the 2D methods. These complexes were isolated by immunocapture, after (32)P labeling in the intact mitochondria, and revealed (32)P-incorporation for the alpha, beta, gamma, OSCP, and d subunits in Complex V and the 75, 51, 42, 23, and 13a kDa subunits in Complex I. These results demonstrate that a dynamic and extensive mitochondrial matrix phosphoproteome exists in heart and liver.


Figures

Figure 1
Figure 1
The Mitochondrial Phosphoproteome of Porcine Heart and Liver. Representative two-dimensional gels are presented to give total protein (Sypro Ruby), total phosphoproteins (Phos-Tag), and 32P labeling occurring in intact heart (A) and liver (B) mitochondria. Numbers refer to the Phos-Tag stained phosphoprotein identifications presented in Table 1. Not all Phos-Tag stained proteins were identified due to the detection limits of mass spectrometry. Four 32P labeled liver proteins were identified from paired Coomassie blue gels because no Phos-Tag signal was detected. Panel C shows a 2D DIGE gel comparing heart (labeled red, Cy3) and liver (labeled green, Cy5) mitochondria. Proteins are separated in the horizontal direction by isoelectric focusing point (pI), from pH ~4 to 10, and vertically by molecular weight, from ~150- to 10 kDa. Panel D shows another 2D 32P autoradiogram of heart mitochondria collected in an identical manner as in Figure 1A. Individual panels show replicates from 4 different animals in different regions of the gel to assess reproducibility. Each panel is labeled for the dominate 32P labeled protein in the zoom area. SCS represents Succinyl CoA Synthetase, the numbered regions in the HSP 60 panel as the same as in Figure 1A.
Figure 1
Figure 1
The Mitochondrial Phosphoproteome of Porcine Heart and Liver. Representative two-dimensional gels are presented to give total protein (Sypro Ruby), total phosphoproteins (Phos-Tag), and 32P labeling occurring in intact heart (A) and liver (B) mitochondria. Numbers refer to the Phos-Tag stained phosphoprotein identifications presented in Table 1. Not all Phos-Tag stained proteins were identified due to the detection limits of mass spectrometry. Four 32P labeled liver proteins were identified from paired Coomassie blue gels because no Phos-Tag signal was detected. Panel C shows a 2D DIGE gel comparing heart (labeled red, Cy3) and liver (labeled green, Cy5) mitochondria. Proteins are separated in the horizontal direction by isoelectric focusing point (pI), from pH ~4 to 10, and vertically by molecular weight, from ~150- to 10 kDa. Panel D shows another 2D 32P autoradiogram of heart mitochondria collected in an identical manner as in Figure 1A. Individual panels show replicates from 4 different animals in different regions of the gel to assess reproducibility. Each panel is labeled for the dominate 32P labeled protein in the zoom area. SCS represents Succinyl CoA Synthetase, the numbered regions in the HSP 60 panel as the same as in Figure 1A.
Figure 2
Figure 2
Time-Course Experiments of 32P Labeling in Heart Mitochondria. A) Time course of 32P labeling in heart mitochondrial proteins using two-dimensional gel electrophoresis. Expansion of the selected region at 1, 5, 20, and 60 minutes demonstrates enhanced labeling of Complex V, β-subunit (protein 9), heat shock protein 60 (protein 6), and heat shock protein 70 (protein 3) with time. Proteins are separated in the horizontal direction by isoelectric focusing point (pI), from pH ~4 to 10, and vertically by molecular weight, from ~150 to 10 kDa. Panel B shows the relative amplitude of 32P labeling, as a function of time, for several identified proteins. Proteins with lower, relative 32P labeling are expanded in Panel C. The protein numbers correspond to those presented in Table 1.
Figure 2
Figure 2
Time-Course Experiments of 32P Labeling in Heart Mitochondria. A) Time course of 32P labeling in heart mitochondrial proteins using two-dimensional gel electrophoresis. Expansion of the selected region at 1, 5, 20, and 60 minutes demonstrates enhanced labeling of Complex V, β-subunit (protein 9), heat shock protein 60 (protein 6), and heat shock protein 70 (protein 3) with time. Proteins are separated in the horizontal direction by isoelectric focusing point (pI), from pH ~4 to 10, and vertically by molecular weight, from ~150 to 10 kDa. Panel B shows the relative amplitude of 32P labeling, as a function of time, for several identified proteins. Proteins with lower, relative 32P labeling are expanded in Panel C. The protein numbers correspond to those presented in Table 1.
Figure 3
Figure 3
Time-Course Experiments of 32P Labeling in Liver Mitochondria using Two-Dimensional Gel Electrophoresis. Expansion of the selected region at 1, 5, 20, and 60 minutes demonstrates enhanced labeling of Complex V, β-subunit (protein 9), heat shock protein 60 (protein 6), and heat shock protein 70 (protein 3) with time. Proteins are separated in the horizontal direction by isoelectric focusing point (pI), from pH ~4 to 10, and vertically by molecular weight, from ~150 to 10 kDa. The protein numbers correspond to those presented in Table 1.
Figure 4
Figure 4
32P Chase Experiments in Heart Mitochondria. A) Schematic Diagram of the 3 conditions used. Panels B, C, and D show the two-dimensional gel electrophoresis of heart proteins at the end of each of the three cases. Proteins are separated in the horizontal direction by isoelectric focusing point (pI), from pH ~4 to 10, and vertically by molecular weight, from ~150 to 10 kDa. The incubation conditions are outlined in the Methods section. The lower panels illustrate the raw (E) and normalized (F) 32P labeling amplitude of several indentified proteins after each incubation case. The protein numbers correspond to those presented in Table 1.
Figure 5
Figure 5
32P Chase Experiments in Liver Mitochondria. Panels A, B and C show the two-dimensional gel electrophoresis of liver proteins at the end of each of the three cases, outlined in Figure 4A. Proteins are separated in the horizontal direction by isoelectric focusing point (pI), from pH ~4 to 10, and vertically by molecular weight, from ~150 to 10 kDa.
Figure 6
Figure 6
Overlay of Heart Mitochondria Protein Content with 32P labeling and Phos-Tag staining. A) Two-dimensional gel electrophoresis overlay of Sypro Ruby stained (green) and Phos-Tag labeled (red) porcine heart mitochondria. B) The expansion of Complex V, β-subunit from Panel A. C) Two-dimensional gel electrophoresis overlay of Coomassie stained (green) and 32P labeled (red) porcine heart mitochondria, based on 4 spatial reference markers. Although several 32P-labeled proteins correspond to Coomassie stained spots, many proteins detected with 32P were not detected with Coomassie, resulting in a predominance of pure red spots. Such proteins lack in total protein content, and therefore identification by mass spectrometry analysis failed to yield results. D) The β-subunit of Complex V reveals an increasing molecular weight shift of the protein’s 32P labeled component relative to its Coomassie stained IEVs. Proteins are separated in the horizontal direction by isoelectric focusing point (pI), from pH ~4 to 10, and vertically by molecular weight, from ~150 to 10 kDa. The relative amplitude for each image was arbitrarily set.
Figure 7
Figure 7
Overlay of Liver Mitochondria Protein Content with 32P labeling and Phos-Tag staining. A) Two-dimensional gel electrophoresis overlay of Sypro Ruby stained (green) and Phos-Tag labeled (red) porcine liver mitochondria. B) Two-dimensional gel electrophoresis overlay of Coomassie stained (green) and low-contrast 32P labeled (red) porcine liver mitochondria, based on 4 spatial reference markers. C) Two-dimensional gel electrophoresis overlay of Coomassie stained (green) and high-contrast 32P labeled (red) porcine liver mitochondria, based on 4 spatial reference markers. The intense 32P labeling of PDHE1α results in saturation before a majority of the other 32P labeled liver proteins can be visualized. Proteins are separated in the horizontal direction by isoelectric focusing point (pI), from pH ~4 to 10, and vertically by molecular weight, from ~150 to 10 kDa. The relative amplitude for each image was arbitrarily set.
Figure 8
Figure 8
One-dimensional Native PAGE of 32P and Phos-Tag Labeled Proteins from Porcine Heart Mitochondria. Blue Native PAGE of 32P labeled mitochondrial proteins with (B) and without (A) acid washing. Ghost-Native PAGE of 32P labeled mitochondrial proteins with (D) and without (C) acid washing. Ghost-Native PAGE of Phos-Tag stained mitochondrial proteins with (F) and without (E) acid washing. Ghost-Native PAGE was used to avoid the interference of the intense blue color of the Coomassie dye used in Blue Native Gels.
Figure 9
Figure 9
Phosphate Labeling of Purified Complex V and Complex I from Porcine Heart Mitochondria. Panel A shows the two-dimensional gel profile of Complex V stained with Sypro Ruby, with subunit identifications obtained by mass spectrometry. Panels B and C show 32P labeled and Phos-Tag stained Complex V, respectively, with expansion of the β-subunit. Panel D shows the two-dimensional gel profile of Complex I stained with Sypro Ruby, with subunit identifications obtained by mass spectrometry. Panels E and F show 32P labeled and Phos-Tag stained Complex I, respectively. Complex I protein identifications are provided in Table 2. Proteins were separated by two-dimensional gel electrophoresis, first in the horizontal direction by isoelectric focusing point (pI), from pH ~4 to 10, and then vertically by molecular weight, from ~150 to 10 kDa.

References

    1. Cohen P. The origins of protein phosphorylation. Nat Cell Biol. 2002;4(5):E127–E130. - PubMed
    1. Linn TC, Pettit FH, Reed LJ. Alpha-keto acid dehydrogenase complexes. X. Regulation of the activity of the pyruvate dehydrogenase complex from beef kidney mitochondria by phosphorylation and dephosphorylation. Proc Natl Acad Sci U S A. 1969;62(1):234–241. - PMC - PubMed
    1. Linn TC, Pettit FH, Hucho F, Reed LJ. Alpha-keto acid dehydrogenase complexes. XI. Comparative studies of regulatory properties of the pyruvate dehydrogenase complexes from kidney, heart, and liver mitochondria. Proc Natl Acad Sci U S A. 1969;64(1):227–234. - PMC - PubMed
    1. Zha J, Harada H, Yang E, Jockel J, Korsmeyer SJ. Serine phosphorylation of death agonist BAD in response to survival factor results in binding to 14-3-3 not BCL-X(L) Cell. 1996;87(4):619–628. - PubMed
    1. Hopper RK, Carroll S, Aponte AM, Johnson DT, French S, Shen RF, Witzmann FA, Harris RA, Balaban RS. Mitochondrial matrix phosphoproteome: effect of extra mitochondrial calcium. Biochemistry. 2006;45(8):2524–2536. - PMC - PubMed

Publication types

MeSH terms

Substances