. 2009 Apr 7:10:148.
doi: 10.1186/1471-2164-10-148.

IMGD: an integrated platform supporting comparative genomics and phylogenetics of insect mitochondrial genomes

Affiliations

IMGD: an integrated platform supporting comparative genomics and phylogenetics of insect mitochondrial genomes

Wonhoon Lee et al. BMC Genomics. .

Abstract

Background: Sequences and organization of the mitochondrial genome have been used as markers to investigate evolutionary history and relationships in many taxonomic groups. The rapidly increasing mitochondrial genome sequences from diverse insects provide ample opportunities to explore various global evolutionary questions in the superclass Hexapoda. To adequately support such questions, it is imperative to establish an informatics platform that facilitates the retrieval and utilization of available mitochondrial genome sequence data.

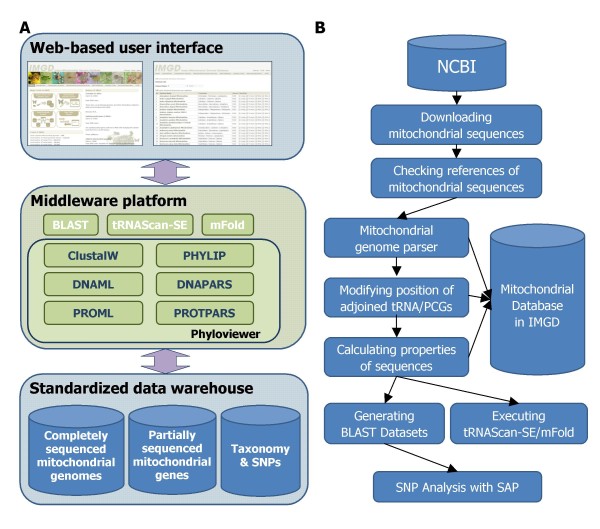
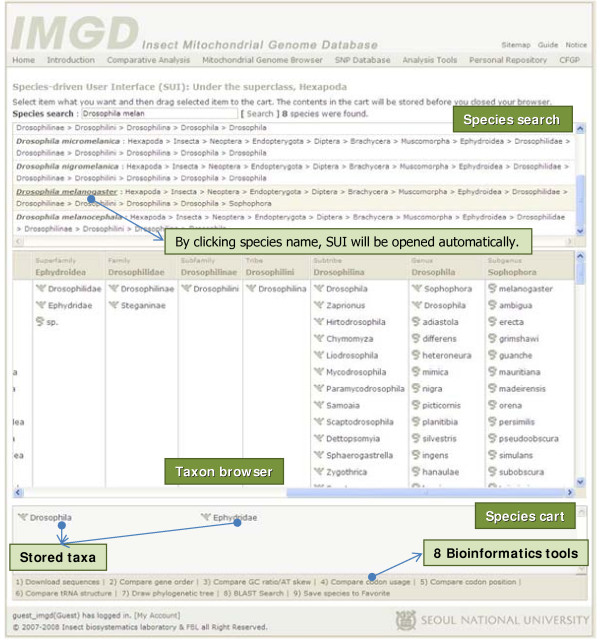
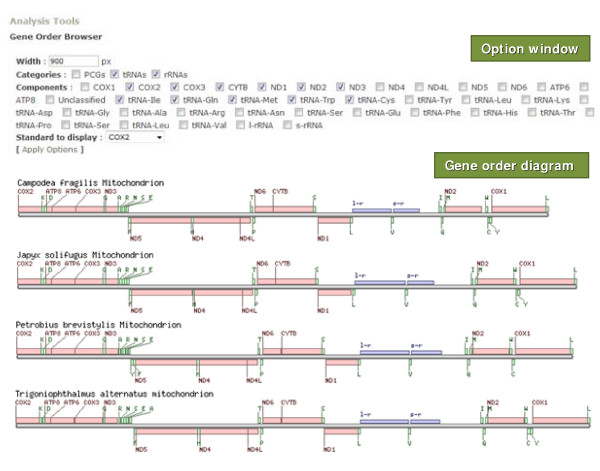
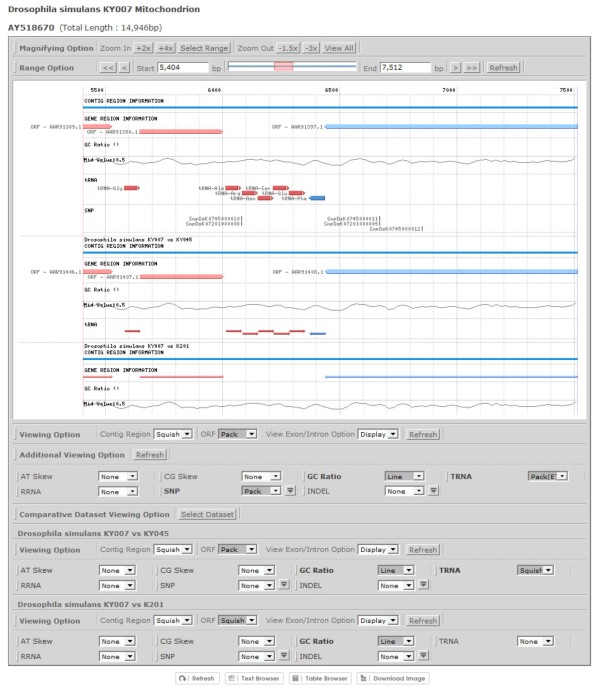
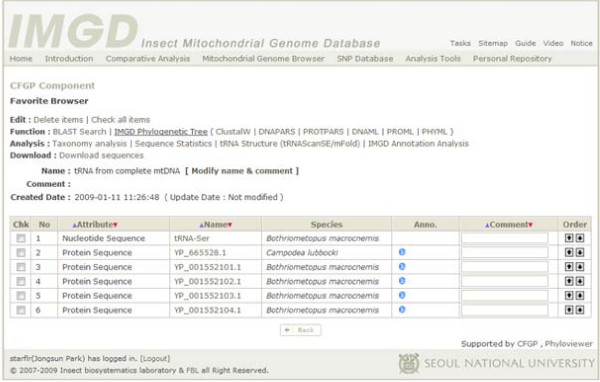
Results: The Insect Mitochondrial Genome Database (IMGD) is a new integrated platform that archives the mitochondrial genome sequences from 25,747 hexapod species, including 112 completely sequenced and 20 nearly completed genomes and 113,985 partially sequenced mitochondrial genomes. The Species-driven User Interface (SUI) of IMGD supports data retrieval and diverse analyses at multi-taxon levels. The Phyloviewer implemented in IMGD provides three methods for drawing phylogenetic trees and displays the resulting trees on the web. The SNP database incorporated to IMGD presents the distribution of SNPs and INDELs in the mitochondrial genomes of multiple isolates within eight species. A newly developed comparative SNU Genome Browser supports the graphical presentation and interactive interface for the identified SNPs/INDELs.

Conclusion: The IMGD provides a solid foundation for the comparative mitochondrial genomics and phylogenetics of insects. All data and functions described here are available at the web site (http://www.imgd.org/).


Figures

Figure 1
Figure 1
The system architecture and pipeline of IMGD. (A) Each rectangular box shows three layers. In the standardized data warehouse, diverse databases are placed. The middleware platform manages not only BLAST, tRNAScan-SE, and mFold but also six phylogenetic tools managed by Phyloviewer (). The web-based user interface supports browsing all information deposited in IMGD. (B) The pipeline for archiving hexapod mitochondrial sequences and calculating their properties was presented as a flowchart diagram.
Figure 2
Figure 2
Estimates of the GC content and genome size of the 132 hexapod mitochondrial genomes. (A) The ranges of the GC content in the nearly completely and the completely sequenced mitochondrial genomes are shown. The closed red circle indicates the average GC content, and the blue and red bars present the maximum and minimum GC contents, respectively. (B) The distribution of mitochondrial genome sizes in different hexapod orders is shown. The closed red circle indicates the average mitochondrial genome size and the blue and red bars present the largest and smallest genome sizes, respectively (see also Table 2 and Table 3).
Figure 3
Figure 3
Examples of phylogenetic analyses conducted using data and tools in IMGD. (A) ML tree of the 24 Hemipteran species (19 completely and 5 nearly completed mitochondrial genomes) with Thrips imaginis (Thysanoptera) as an outgroup was constructed using DNAML. S, Sternorrhyncha; A, Auchenorrhyncha; H, Heteroptera. (B) MP tree built based on 88 COI sequences from 70 Phthirapteran species using DNAPARS, is shown. Ptycta johnsoni (Psocoptera) was used as an outgroup. The blue square indicates the sequences originated from Johnson and Whiting (2002) [42]; green square, Johnson et al. (2003) [43]; blue triangle, Price and Johnson (2006) [44]; red, violet and yellow squares, and red triangle present unpublished mitochondrial gene sequences. (C) MP tree using 90 COI sequences from 14 Mantophasmatodean species, with Galloisiana yuasai (Grylloblattodea) as an outgroup, was drawn using DNAPARS. The red circle indicates the mitochondrial sequences reported by Damgaard et al. (2008) [46] and violet circle presents the sequences from the study of Klass et al. (2003) [45]. The numbers on individual nodes of the trees in A, B, and C indicate bootstrap values with 10, 100, and 100 repeats, respectively, and the names of the species used and NCBI accession numbers are shown at the end of individual branches.
Figure 4
Figure 4
Distribution of SNPs in 13 PCGs in 9 mitochondrial genomes. The bar graph displays the distribution of SNPs in 13 PCGs of three insect species: BO, Bactrocera oleae; DS, Drosophila simulans; RF, Reticulitermes flavipes. ATP6 and 8 (ATP synthase subunit 6 and 8); COX1–3 (cytochrome c oxidase subunits I–III); CYTB (cytochrome b); ND1–6 (NADH dehydrogenase subunits 1–6); ND4L (NADH dehydrogenase subunit 4L) (see also Table 4).
Figure 5
Figure 5
Species-driven User Interface (SUI) optimized for collecting data based on taxa. The Species-driven User Interface (SUI) consists of three parts: i) Species search, ii) Taxon browser, and iii) Species cart. The Species search function supports the search of species by species name. The Taxon browser provides the interface for browsing taxa in a hierarchical manner. The Species cart can store selected taxa, bridging the data from them to nine bioinformatics tools.
Figure 6
Figure 6
Gene order browser for graphical presentation of the mitochondrial gene order. The gene order browser consists of two parts: one is the option window and the other is the gene order diagram. In the option window, three options, including width, categories, and components, are displayed. After clicking 'Apply Options,' a gene order diagram based on the chosen option will be displayed. To indicate the nature of specific genetic elements on displayed mitochondrial genomes, the following abbreviations were used: A, tRNA-Ala;C, tRNA-Cys; D, tRNA-Asp; E, tRNA-Glu; F, tRNA-Phe; G, tRNA-Gly; H, tRNA-His; I, tRNA-Ile; K, tRNA-Lys; L, tRNA-Leu; M, tRNA-Met; N, tRNA-Asn; P, tRNA-Pro; Q, tRNA-Gln; R, tRNA-Arg; S, tRNA-Ser; T, tRNA-Thr; V, tRNA-Val; W, tRNA-Trp; Y, tRNA-Tyr; COX1–3, cytochrome c oxidase subunits I–III; CYTB, cytochrome b; ATP6 and ATP8, subunits 6 and 8 of the F0ATPase; ND1–6 and nad4L, NADH dehydrogenase subunits 1–6 and 4L; l-r and s-r, large and small subunit of ribosomal RNA genes; PCGs, protein coding genes; rRNAs, ribosomal RNA genes; tRNAs, transfer RNA genes.
Figure 7
Figure 7
Interactive graphical interface for visualizing aligned mitochondrial genomes via the SNU Genome Browser. The SNU Genome Browser displays SNPs/INDELs as well as PCGs, tRNAs, GC contents among the aligned genomes of Drosophila simulans KY007, KY045, and K201 strains.
Figure 8
Figure 8
Favorite, a personalized virtual space for data storage and further analyses. The browser in Favorite provides four options: 'Edit,' 'Function,' 'Analysis,' and 'Download.' Any sequences listed at the bottom part can be selected by users for analyzing the selected sequences using seven programs and four analysis tools via the web.

References

    1. Rawlings TA, Collins TM, Bieler R. A major mitochondrial gene rearrangement among closely related species. Mol Biol Evol. 2001;18:1604–1609. - PubMed
    1. Dowton M. Relationships among the cyclostome braconid (Hymenoptera: Braconidae) subfamilies inferred from a mitochondrial tRNA gene rearrangement. Mol Phylogenet Evol. 1999;11:283–287. doi: 10.1006/mpev.1998.0580. - DOI - PubMed
    1. Boore JL. Animal mitochondrial genomes. Nucleic Acids Res. 1999;27:1767–1780. doi: 10.1093/nar/27.8.1767. - DOI - PMC - PubMed
    1. Boore JL, Brown WM. Big trees from little genomes: mitochondrial gene order as a phylogenetic tool. Curr Opin Genet Dev. 1998;8:668–674. doi: 10.1016/S0959-437X(98)80035-X. - DOI - PubMed
    1. Boore JL, Lavrov DV, Brown WM. Gene translocation links insects and crustaceans. Nature. 1998;392:667–668. doi: 10.1038/33577. - DOI - PubMed

Publication types

LinkOut - more resources