

Enrichment constrained time-dependent clustering analysis for finding meaningful temporal transcription modules
- PMID: 19351618
- PMCID: PMC2687989
- DOI: 10.1093/bioinformatics/btp235
Enrichment constrained time-dependent clustering analysis for finding meaningful temporal transcription modules
Abstract
Motivation: Clustering is a popular data exploration technique widely used in microarray data analysis. When dealing with time-series data, most conventional clustering algorithms, however, either use one-way clustering methods, which fail to consider the heterogeneity of temporary domain, or use two-way clustering methods that do not take into account the time dependency between samples, thus producing less informative results. Furthermore, enrichment analysis is often performed independent of and after clustering and such practice, though capable of revealing biological significant clusters, cannot guide the clustering to produce biologically significant result.
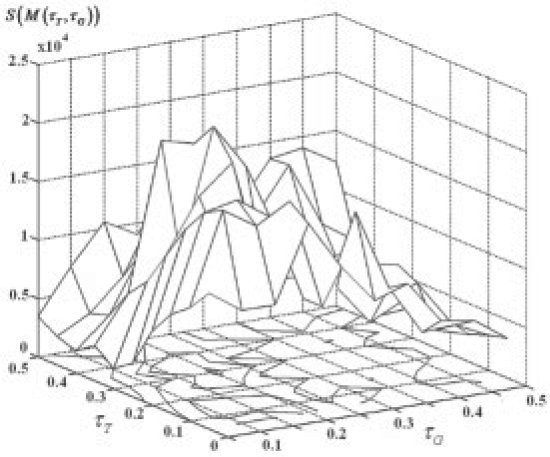
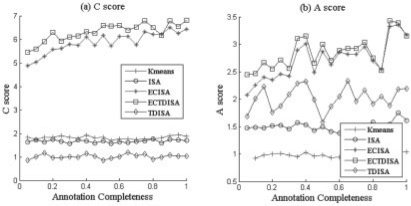
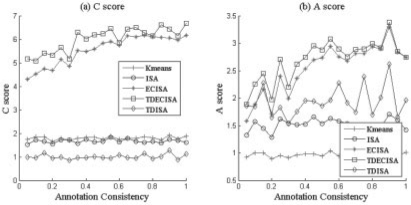
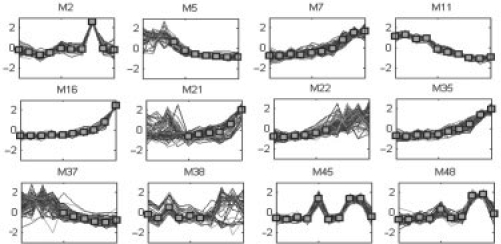
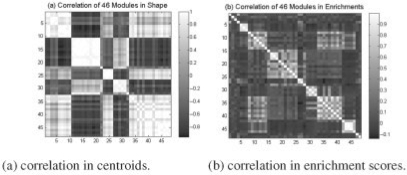
Result: We present a new enrichment constrained framework (ECF) coupled with a time-dependent iterative signature algorithm (TDISA), which, by applying a sliding time window to incorporate the time dependency of samples and imposing an enrichment constraint to parameters of clustering, allows supervised identification of temporal transcription modules (TTMs) that are biologically meaningful. Rigorous mathematical definitions of TTM as well as the enrichment constraint framework are also provided that serve as objective functions for retrieving biologically significant modules. We applied the enrichment constrained time-dependent iterative signature algorithm (ECTDISA) to human gene expression time-series data of Kaposi's sarcoma-associated herpesvirus (KSHV) infection of human primary endothelial cells; the result not only confirms known biological facts, but also reveals new insight into the molecular mechanism of KSHV infection.
Availability: Data and Matlab code are available at http://engineering.utsa.edu/ approximately yfhuang/ECTDISA.html.
Supplementary information: Supplementary data are available at Bioinformatics online.
Figures
Similar articles
-
Biclustering of time series microarray data.Methods Mol Biol. 2012;802:87-100. doi: 10.1007/978-1-61779-400-1_6. Methods Mol Biol. 2012. PMID: 22130875
-
Microarray data mining using landmark gene-guided clustering.BMC Bioinformatics. 2008 Feb 11;9:92. doi: 10.1186/1471-2105-9-92. BMC Bioinformatics. 2008. PMID: 18267003 Free PMC article.
-
Temporal clustering by affinity propagation reveals transcriptional modules in Arabidopsis thaliana.Bioinformatics. 2010 Feb 1;26(3):355-62. doi: 10.1093/bioinformatics/btp673. Epub 2009 Dec 8. Bioinformatics. 2010. PMID: 19996165
-
Combining Pareto-optimal clusters using supervised learning for identifying co-expressed genes.BMC Bioinformatics. 2009 Jan 20;10:27. doi: 10.1186/1471-2105-10-27. BMC Bioinformatics. 2009. PMID: 19154590 Free PMC article.
-
Comparing algorithms for clustering of expression data: how to assess gene clusters.Methods Mol Biol. 2009;541:479-509. doi: 10.1007/978-1-59745-243-4_21. Methods Mol Biol. 2009. PMID: 19381534 Review.
Cited by
-
Regulatory Snapshots: integrative mining of regulatory modules from expression time series and regulatory networks.PLoS One. 2012;7(5):e35977. doi: 10.1371/journal.pone.0035977. Epub 2012 May 1. PLoS One. 2012. PMID: 22563474 Free PMC article.
-
Robust inference of the context specific structure and temporal dynamics of gene regulatory network.BMC Genomics. 2010 Dec 1;11 Suppl 3(Suppl 3):S11. doi: 10.1186/1471-2164-11-S3-S11. BMC Genomics. 2010. PMID: 21143778 Free PMC article.
-
A hierarchical Bayesian model for flexible module discovery in three-way time-series data.Bioinformatics. 2015 Jun 15;31(12):i17-26. doi: 10.1093/bioinformatics/btv228. Bioinformatics. 2015. PMID: 26072479 Free PMC article.
-
Function-based discovery of significant transcriptional temporal patterns in insulin stimulated muscle cells.PLoS One. 2012;7(3):e32391. doi: 10.1371/journal.pone.0032391. Epub 2012 Mar 1. PLoS One. 2012. PMID: 22396763 Free PMC article.
-
REW-ISA V2: A Biclustering Method Fusing Homologous Information for Analyzing and Mining Epi-Transcriptome Data.Front Genet. 2021 May 28;12:654820. doi: 10.3389/fgene.2021.654820. eCollection 2021. Front Genet. 2021. PMID: 34122508 Free PMC article.
References
-
- Bergmann S, et al. Iterative signature algorithm for the analysis of large-scale gene expression data. Phys Rev. E Stat. Nonlin. Soft. Matter Phys. 2003;67:031902. - PubMed
-
- Bittner M, et al. Data analysis and integration: of steps and arrows. Nat. Genet. 1999;22:213–215. - PubMed
-
- Califano A, et al. Analysis of gene expression microarrays for phenotype classification. Proc. Int. Conf. Intell. Syst. Mol. Biol. 2000;8:75–85. - PubMed
Publication types
MeSH terms
Grants and funding
LinkOut - more resources
Full Text Sources
Molecular Biology Databases
