. 2009 Apr 15;15(8):2829-39.
doi: 10.1158/1078-0432.CCR-08-2432. Epub 2009 Apr 7.

Gene expression patterns in mismatch repair-deficient colorectal cancers highlight the potential therapeutic role of inhibitors of the phosphatidylinositol 3-kinase-AKT-mammalian target of rapamycin pathway

Affiliations

Gene expression patterns in mismatch repair-deficient colorectal cancers highlight the potential therapeutic role of inhibitors of the phosphatidylinositol 3-kinase-AKT-mammalian target of rapamycin pathway

Eduardo Vilar et al. Clin Cancer Res. .

Abstract

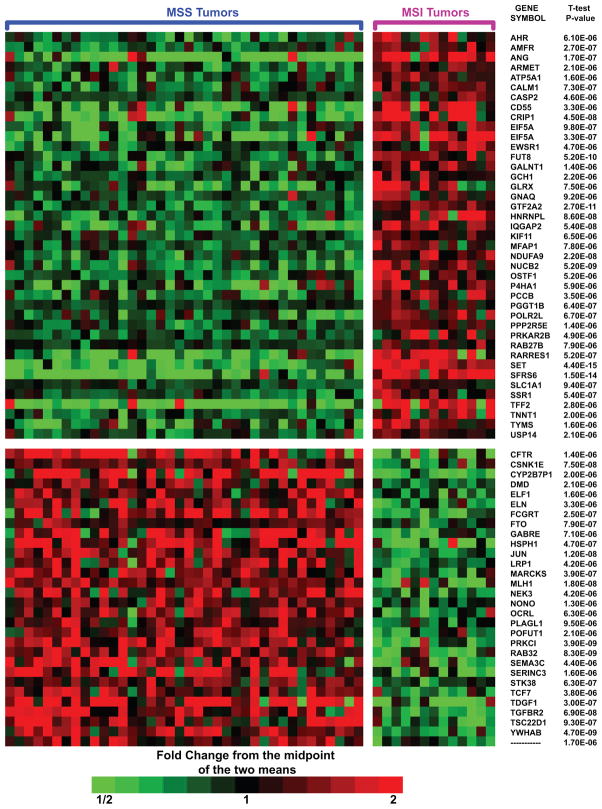
Purpose: High-frequency microsatellite-instable (MSI-H) tumors account for approximately 15% of colorectal cancers. Therapeutic decisions for colorectal cancer are empirically based and currently do not emphasize molecular subclassification despite an increasing collection of gene expression information. Our objective was to identify low molecular weight compounds with preferential activity against MSI colorectal cancers using combined gene expression data sets.

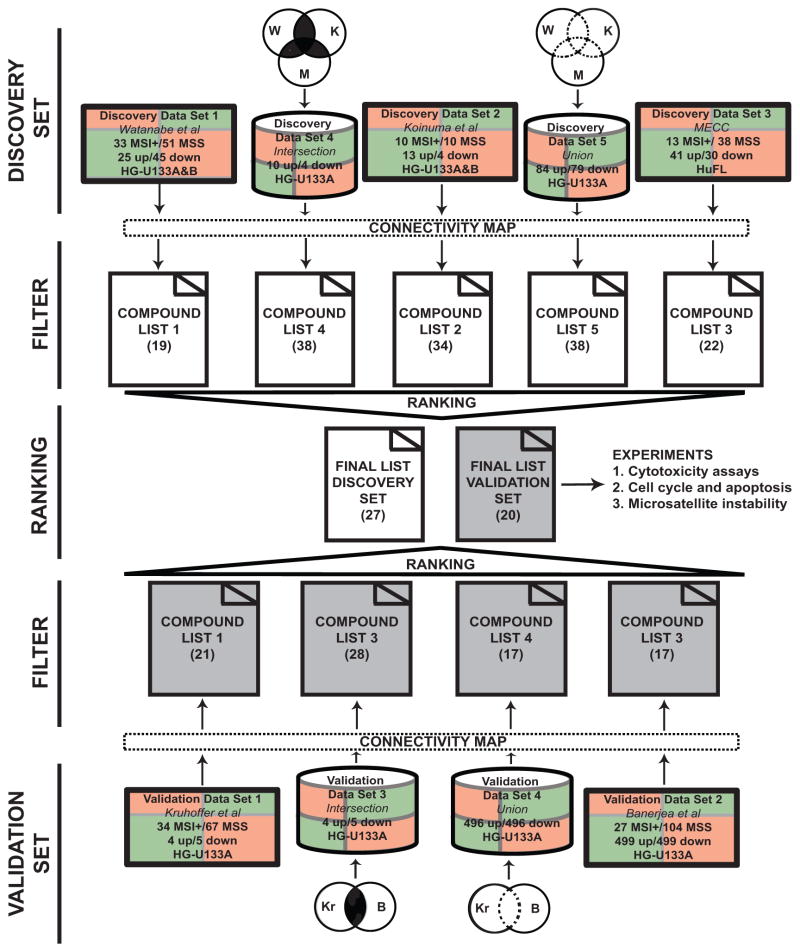
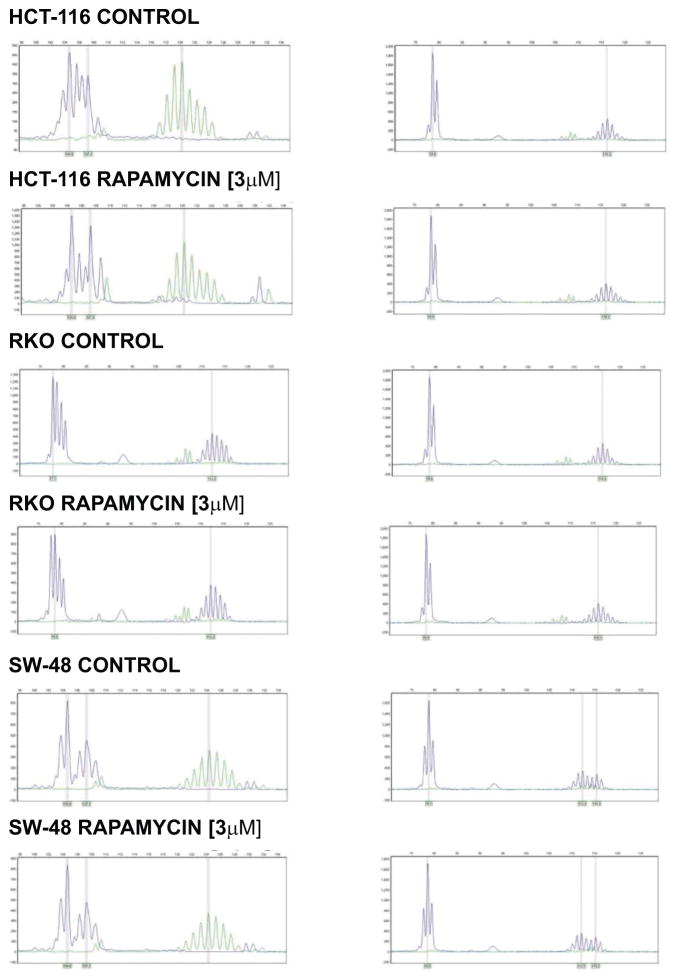
Experimental design: Three expression/query signatures (discovery data set) characterizing MSI-H colorectal cancer were matched with information derived from changes induced in cell lines by 164 compounds using the systems biology tool "Connectivity Map." A series of sequential filtering and ranking algorithms were used to select the candidate compounds. Compounds were validated using two additional expression/query signatures (validation data set). Cytotoxic, cell cycle, and apoptosis effects of validated compounds were evaluated in a panel of cell lines.

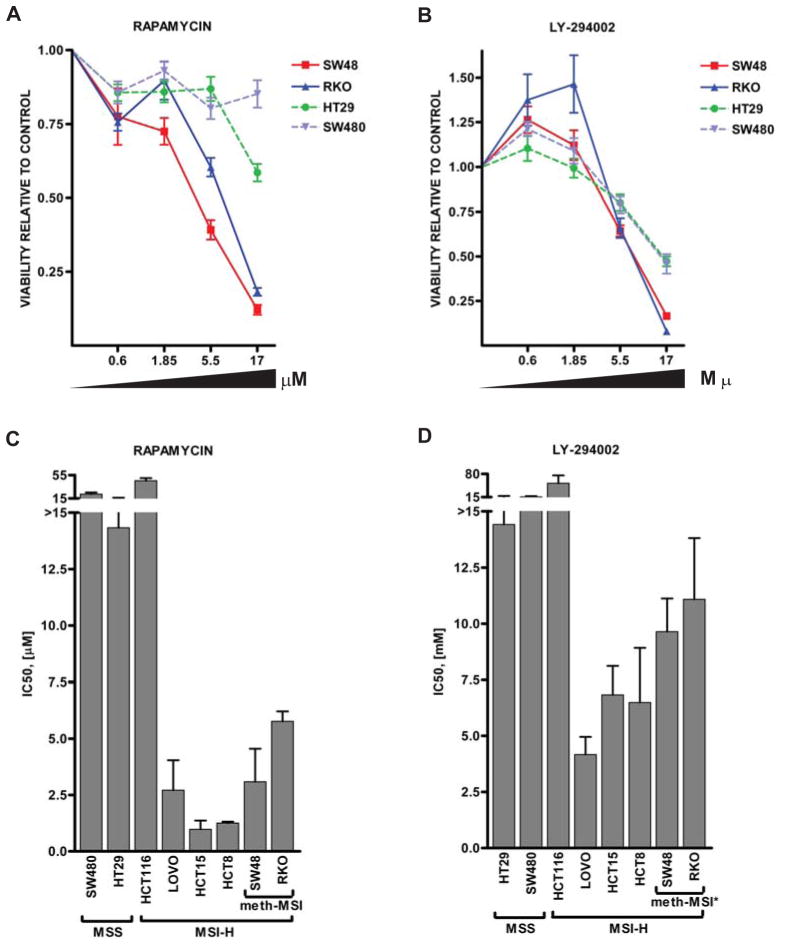
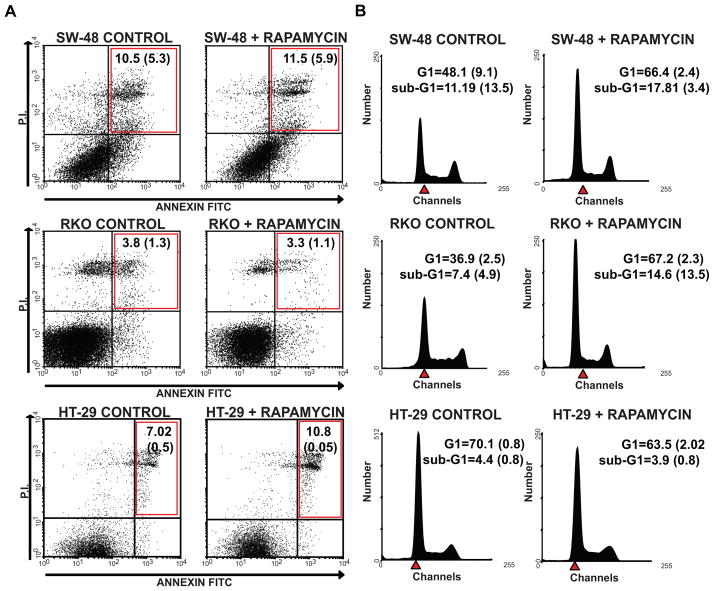
Results: Fourteen of the 164 compounds were validated as targeting MSI-H cell lines using the bioinformatics approach; rapamycin, LY-294002, 17-(allylamino)-17-demethoxygeldanamycin, and trichostatin A were the most robust candidate compounds. In vitro results showed that MSI-H cell lines due to hypermethylation of MLH1 are preferentially targeted by rapamycin (18.3 versus 4.4 mumol/L; P = 0.0824) and LY-294002 (15.02 versus 10.37 mumol/L; P = 0.0385) when compared with microsatellite-stable cells. Preferential activity was also observed in MSH2 and MSH6 mutant cells.

Conclusion: Our study shows that the phosphatidylinositol 3-kinase-AKT-mammalian target of rapamycin pathway is of special relevance in mismatch repair-deficient colorectal cancer. In addition, we show that amalgamation of gene expression information across studies provides a robust approach for selection of potential therapies corresponding to specific groups of patients.


Figures

Figure 1
Figure 1
Differentially expressed genes in MSI-H and MSS tumors from the MECC study. Tumors exhibiting the MSI-L phenotype were excluded. Each column corresponds to a separate sample and they are grouped by microsatellite status. Each row represents a probe set with P-value <0.00001 (FDR<0.1%) whose expression is color-coded according to the indicated scale and are displayed by alphabetical order. Gene symbols of HuFL probe sets and its corresponding P-values are shown at the right. Note that General Transcription Factor IIA (GTF2A2), Eukaryotic Translation Initiation Factor 5a (EIF5A), Splicing Factor Arginine/Serine-rich 6 (SFRS6), Thymidylate Synthetase (TYMS), a member of ras oncogene family Rab27b (RAB27B) and Protein Kinase cAMP-dependent type II (PRKAR2B) showed overexpression in MSI-H cancers. On the other hand, Protein Kinase C (PRKCI), mutL Homolog 1 (MLH1) and Transforming Growth Factor β Receptor II (TGFBR2) showed lower expression inMSI-H cancers. A complete list with HuFL probe set ID, gene symbol and gene title is presented in Supplementary Table S2.
Figure 2
Figure 2
Gene expression data sets used and the flowchart for generation of a final compounds list. Gene expression data coming from 5 different studies were divided in two sets, discovery and validation set. In addition two artificial signatures were created for each set, the intersection and the union signature. Information on the total number of MSI and MSS tumors, number of significantly expressed upregulated and downregulated probes and the array platform used to generate expression data are indicated in the rectangles representing every study. Number of compounds that passed the two filters per study is indicated in parentheses. Note that filters applied to Connectivity Map results rule out those compounds with only one experimental instance thus limiting the total number of compounds to 95.
Figure 3
Figure 3
(A, B) Differential sensitivity of CRC cell lines to treatment with Rapamycin and LY-294002 for 5 days. Shown are the MLH1 promoter hypermethylated cell lines (SW-48 and RKO) and MSS cell lines (HT-29 and SW-480). Points, mean (n=3 experiments); bars, ±standard deviation (SD) (C, D) MSI-H confers sensitivity to Rapamycin and low levels of sensitivity to LY-294002. First column, mean IC50 values as a function of mismatch repair genes status (n=3 experiments); bars, ±standard error (SE). IC50 for growth inhibition by Rapamycin differed markedly in a manner that correlated with microsatellite status. MSS cells exhibited resistance to Rapamycin at concentrations higher than 15 μM. Second column, IC50 for growth inhibition by LY-294002 differed in a manner that correlated with microsatellite status. MSS cells exhibited resistance to LY-294002 at concentrations higher than 15 μM. Mean IC50 of MSS were statistically significantly different with respect to Meth-MSI cell lines (*P=0.0358) Meth-MSI, microsatellite-instability due to hypermethylation of MLH1; MSI-H, microsatellite instability-high; MSI-H*, microsatellite instability-high excluding HCT-116.
Figure 4
Figure 4
Microsatellite instability in mismatch repair-deficient cell lines following treatment with Rapamycin. For this specific purpose, we relied on four mononucleotide microsatellite markers (BAT25, BAT26, β-Catenin and TGF-β) since there is no corresponding normal tissue to measure MSI using dinucleotide markers in cell lines. Markers are presented as follow: first column, BAT26 and β-Catenin; second column, TGF-β and BAT25. Grey bars represent the position of mayor allele after five days of treatment. No dose-dependent stabilization of microsatellite markers was observed in cells treated with Rapamycin 3 μM during five consecutive days.
Figure 5
Figure 5
(A) Effects of Rapamycin on apoptosis in SW-48 (first row), RKO (second row) and HT-29 (third row). AnnexinV/PI cytograms of cell lines following treatment with Rapamycin 3 μM during five consecutive days. Control cells were grown in free-drug medium. X axis, AnnexinV; y axis, PI staining. Annexin V–positive, PI-negative cells reflect cells in the early stages of apoptosis (lower right quadrant), whereas Annexin V–positive, PI-positive cells reflect dead cells or cells at the late stages of apoptosis (upper right quadrant) in at least three independent experiments. Mean of cell percentages ± SD at late apoptosis are quantified in upper right quadrants. Untreated cells showed 81–88% viability (first column); Rapamycin did not induce apoptosis, consistent with its previously described cytostatic effect (second column). (B) Effects of Rapamycin on cell cycle using PI staining. DNA histograms of SW-48 (first row), RKO (second row) and HT-29 (third row) CRC cell lines following treatment with Rapamycin 3 μM for five days. Control cells were grown in free-drug medium. No changes in apoptosis were observed by sub-G1 results. G1 arrest under treatment with Rapamycin was observed in MSI-H cells being statistically significant in RKO (P=0.006) and no effect on the MSS HT-29 cell line (Figures 5B and Supplementary Figure S2). Results are reported as the mean±SD done in at least two replicate samples. Vilar et al - Table 1

References

    1. Jemal A, Siegel R, Ward E, et al. Cancer statistics, 2008. CA Cancer J Clin. 2008;58:71–96. - PubMed
    1. SEER. US Mortality Age-Adjusted Rates, Total US 1990–1999: US National Center for Health Statistics. 2002.
    1. Amado RG, Wolf M, Peeters M, et al. Wild-type KRAS is required for panitumumab efficacy in patients with metastatic colorectal cancer. J Clin Oncol. 2008;26:1626–34. - PubMed
    1. Khambata-Ford S, Garrett CR, Meropol NJ, et al. Expression of epiregulin and amphiregulin and K-ras mutation status predict disease control in metastatic colorectal cancer patients treated with cetuximab. J Clin Oncol. 2007;25:3230–7. - PubMed
    1. Lievre A, Bachet JB, Boige V, et al. KRAS mutations as an independent prognostic factor in patients with advanced colorectal cancer treated with cetuximab. J Clin Oncol. 2008;26:374–9. - PubMed

Publication types

MeSH terms

Associated data