. 2009 Apr 15;69(8):3433-42.
doi: 10.1158/0008-5472.CAN-08-3506. Epub 2009 Apr 7.

Osteoblast-derived factors induce an expression signature that identifies prostate cancer metastasis and hormonal progression

Affiliations

Osteoblast-derived factors induce an expression signature that identifies prostate cancer metastasis and hormonal progression

Gang Wang et al. Cancer Res. .

Abstract

Identification of gene expression signatures associated with metastases provides a tool to discern mechanisms and potential therapeutic targets and may lead toward a molecular classification system in pathology. Prostate cancer (CaP) frequently metastasizes to the bone to form osteoblastic lesions. Correlative clinical data and in vitro evidence have led to the hypothesis that osteoblast-derived factors promote hormonal progression of CaP cells. Here, the gene expression signature of CaP exposed to osteoblast-derived factors was identified. This signature included known androgen-regulated genes, oncogenes, tumor suppressors, and genes whose products are involved in apoptosis and cell cycle. A comparative functional genomic approach involved the application of this responsive gene expression signature to clinical samples of human CaP, melanomas, and oral cancers. Cluster analysis revealed that this gene expression signature had specificity for CaP and could resolve clinical specimens according to stage (benign, localized, and metastatic) and androgen sensitivity with an accuracy of 100% and 80%, respectively. Together, these results suggest that factors derived from osteoblasts induce a more advanced phenotype of CaP and promotes hormonal progression.


Figures

Figure 1
Figure 1. Osteoblast-derived factors promote survival and proliferation of CaP
(A) Cell proliferation was assessed by BrdU incorporation. Fold-induction was calculated relative to ethanol-treated samples. (B) Cell cycle analysis of differentially treated cells using BrdU incorporation and FACS analysis. (C) Analysis of apoptosis of differentially treated cells by TUNEL staining (green) counterstained with propidium iodide (red). The bars represent the mean ± standard deviation. Student t-test: *, p≤0.05; **,p≤0.01, ***,p≤0.001.
Figure 2
Figure 2. Osteoblasts promote in vivo hormonal progression of CaP
H&E staining of LNCaP cells co-cultured with osteoblast-like cells (OB) (A) or without OB (B) in hollow fibers that were implanted in mice. (C) Changes in levels of serum PSA from mice bearing fibers containing solely LNCaP cells (n=12) or fibers with LNCaP+OB (n=12) before and after castration (Cx). The bars represent the mean ± standard error. Student t-test: *, p≤ 0.05.
Figure 3
Figure 3. OCM-inducible signaling pathways
(A) I/II, Levels of tyrosine phosphor (pTyr Stat3), serine phosphor (pSer Stat3) and total (tStat3) STAT3 in LNCaP cells treated with 50% of OCM, 50ng/ml IL-6 (positive control), and negative controls FCM and conditioned media from LNCaP (LCM). III/IV, cells were pretreated for 30 min with the JAK2 inhibitor, AG490 (50uM). IL-6 was blocked by pre-treating the OCM with IL-6 neutralizing antibody (anti-IL6, 10ug/ml). IgG served as an isotype control. (B) Phosphor (pErk1/2) and total (tErk1/2) ERK1/2 levels. (C) I, Phosphor ErbB2 (pErbB2) and phosphor AKT (pAKT) levels. II, cells were pretreated for 30min with the ErbB2 inhibitor, AG879 (20uM). CRP, a cross-reactive protein (loading control). (D) Effects of kinase inhibitors on OCM-induced ERK1/2 phosphorylation. Cells were pre-treated with inhibitors or vehicle (DMSO) for 30 minutes prior to treatment with 50% OCM.
Figure 4
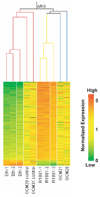
Figure 4. Osteoblast-derived factors stimulate the androgen axis in CaP
Hierarchical clustering based on the androgen-responsive expression signature of all 6 samples treated with synthetic androgen (R1881) and 4 samples treated with OCM. Red color indicates high expression and a green color indicates low expression of a gene. The genes are represented by each row and the experimental samples are represented by each column.
Figure 5
Figure 5. OCM gene expression signature can distinguish various stages of CaP
Affymetrix datasets of clinical CaP were downloaded from PUBMED GEO (GDS1439 and GSE6919). Total of 40 OCM regulated genes from SI Table 2 were applied as the gene signature. (A) Sample clustering to measure the similarity of the expression pattern between different samples from GDS1439 according to the gene expression signature. (B) I, Principle component analysis distinctly clustered the clinical samples from GDS1439 into three groups which closely correlate to the three different stages (benign prostate tissue, localized and metastatic CaP). II, Class prediction analysis applying the gene expression signature provided each clinical sample from GDS1439 with an individual OCM margin which represents the likelihood of exposure to OCM. Student t-test was applied to calculate the p-value for the difference between groups. (C) I, Principle component analysis distinctly clustered the clinical samples from GSE6919. II, Class prediction analysis applying the gene expression signature provided each clinical sample from GSE6919 with an individual OCM margin which represents the likelihood of exposure to OCM. Student t-test was applied to calculate the p-value for the difference between groups. (D) Sample clustering to measure the similarity of the Q-PCR measured expression pattern between clinical samples from different metastasis sites according to the expression of a subset of genes in the signature. BM: bone metastasis; LM: lymph node metastasis.
Figure 6
Figure 6. OCM gene expression signature identifies castration-recurrent disease
Affymetrix datasets of clinical CaP were downloaded from PUBMED GEO (GDS1390). Total of 40 OCM regulated genes from SI Table 2 were applied as the gene signature. (A) Sample clustering to measure the similarity of the expression pattern between different samples according to the gene expression signature induced by OCM. (B) Principle component analysis clustered the clinical samples into two groups which closely correlate to the two different stages (castration-recurrent/androgen-independent vs androgen-dependent). (C) Class prediction analysis applying the gene expression signature provided each clinical sample with an individual OCM margin that represents the likelihood of exposure to OCM. Student t-test was applied.

References

    1. Cheville JC, Tindall D, Boelter C, et al. Metastatic prostate carcinoma to bone: clinical and pathologic features associated with cancer-specific survival. Cancer. 2002;95:1028–1036. - PubMed
    1. Wang G, Sadar MD. Amino-terminus domain of the androgen receptor as a molecular target to prevent the hormonal progression of prostate cancer. J Cell Biochem. 2006;98:36–53. - PubMed
    1. Blaszczyk N, Masri BA, Mawji NR, et al. Osteoblast-derived factors induce androgen-independent proliferation and expression of prostate-specific antigen in human prostate cancer cells. Clin Cancer Res. 2004;10:1860–1869. - PubMed
    1. Gleave M, Hsieh JT, Gao CA, von Eschenbach AC, Chung LW. Acceleration of human prostate cancer growth in vivo by factors produced by prostate and bone fibroblasts. Cancer Res. 1991;51:3753–3761. - PubMed
    1. Rickard DJ, Kassem M, Hefferan TE, Sarkar G, Spelsberg TC, Riggs BL. Isolation and characterization of osteoblast precursor cells from human bone marrow. J Bone Miner Res. 1996;11:312–324. - PubMed

Publication types

Substances