

The universal distribution of evolutionary rates of genes and distinct characteristics of eukaryotic genes of different apparent ages
- PMID: 19351897
- PMCID: PMC2666616
- DOI: 10.1073/pnas.0901808106
The universal distribution of evolutionary rates of genes and distinct characteristics of eukaryotic genes of different apparent ages
Abstract
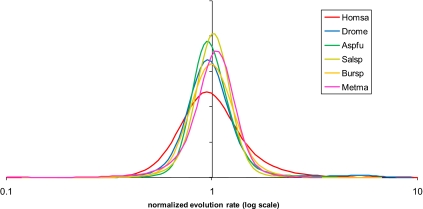
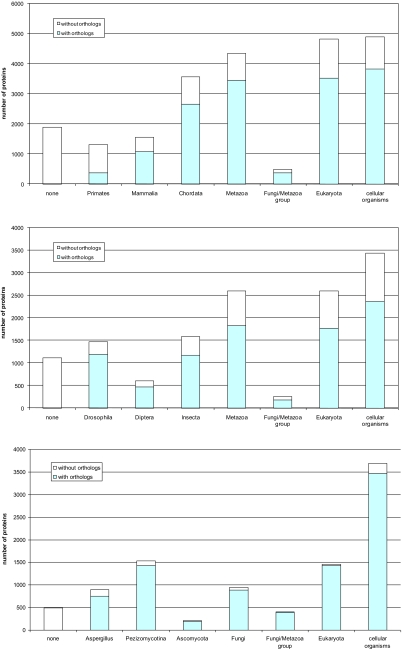
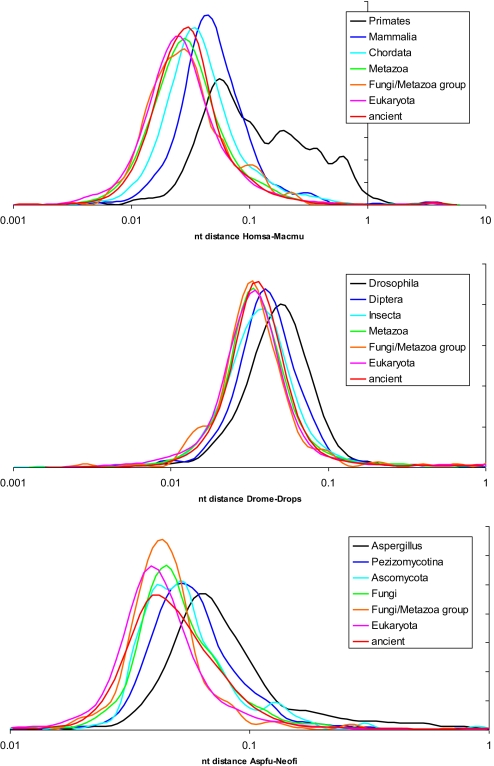
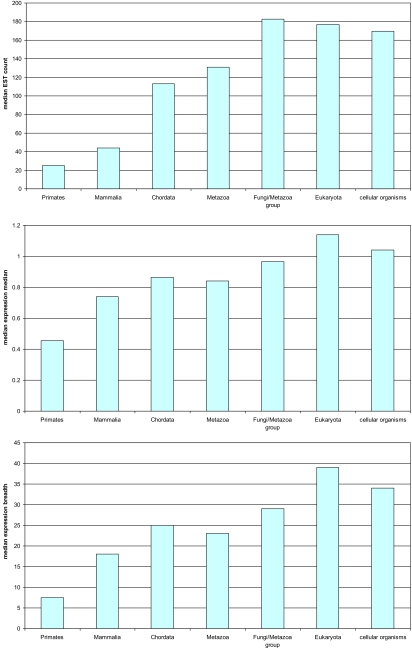
The evolutionary rates of protein-coding genes in an organism span, approximately, 3 orders of magnitude and show a universal, approximately log-normal distribution in a broad variety of species from prokaryotes to mammals. This universal distribution implies a steady-state process, with identical distributions of evolutionary rates among genes that are gained and genes that are lost. A mathematical model of such process is developed under the single assumption of the constancy of the distributions of the propensities for gene loss (PGL). This model predicts that genes of different ages, that is, genes with homologs detectable at different phylogenetic depths, substantially differ in those variables that correlate with PGL. We computationally partition protein-coding genes from humans, flies, and Aspergillus fungus into age classes, and show that genes of different ages retain the universal log-normal distribution of evolutionary rates, with a shift toward higher rates in "younger" classes but also with a substantial overlap. The only exception involves human primate-specific genes that show a heavy tail of rapidly evolving genes, probably owing to gene annotation artifacts. As predicted, the gene age classes differ in characteristics correlated with PGL. Compared with "young" genes (e.g., mammal-specific human ones), "old" genes (e.g., eukaryote-specific), on average, are longer, are expressed at a higher level, possess a higher intron density, evolve slower on the short time scale, and are subject to stronger purifying selection. Thus, genome evolution fits a simple model with approximately uniform rates of gene gain and loss, without major bursts of genomic innovation.
Conflict of interest statement
The authors declare no conflict of interest.
Figures
References
-
- Doolittle WF. Lateral genomics. Trends Cell Biol. 1999;9:M5–M8. - PubMed
-
- Ochman H, Lawrence JG, Groisman EA. Lateral gene transfer and the nature of bacterial innovation. Nature. 2000;405:299–304. - PubMed
-
- Embley TM, Martin W. Eukaryotic evolution, changes and challenges. Nature. 2006;440:623–630. - PubMed
-
- Esser C, et al. A genome phylogeny for mitochondria among alpha-proteobacteria and a predominantly eubacterial ancestry of yeast nuclear genes. Mol Biol Evol. 2004;21:1643–1660. - PubMed
Publication types
MeSH terms
Substances
LinkOut - more resources
Full Text Sources
Medical
Research Materials
