. 2009 Apr 15;101(8):592-604.
doi: 10.1093/jnci/djp058. Epub 2009 Apr 7.

Diffuse-type gastric carcinoma: progression, angiogenesis, and transforming growth factor beta signaling

Affiliations

Diffuse-type gastric carcinoma: progression, angiogenesis, and transforming growth factor beta signaling

Akiyoshi Komuro et al. J Natl Cancer Inst. .

Abstract

Background: Diffuse-type gastric carcinoma is a cancer with poor prognosis that has high levels of transforming growth factor beta (TGF-beta) expression and thick stromal fibrosis. However, the association of TGF-beta signaling with diffuse-type gastric carcinoma has not been investigated in detail.

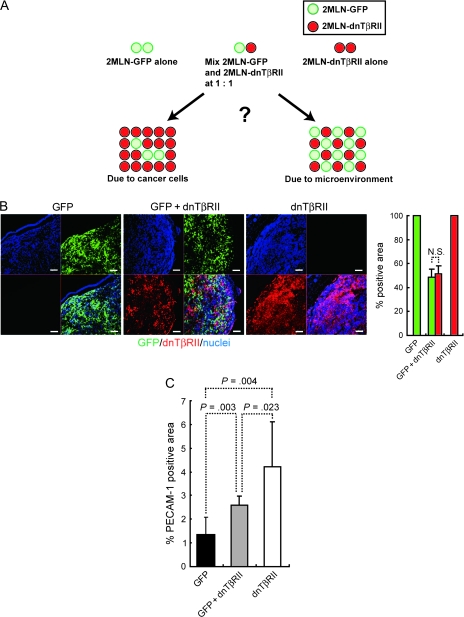
Methods: We used a lentiviral infection system to express a dominant-negative TGF-beta type II receptor (dnTbetaRII) or green fluorescent protein (GFP) as a control in the diffuse-type gastric carcinoma cell lines, OCUM-2MLN and OCUM-12. These infected cells and the corresponding parental control cells were subcutaneously or orthotopically injected into nude mice. Angiogenesis was inhibited by infecting cells with a lentivirus carrying the gene for angiogenic inhibitor thrombospondin-1 or by injecting mice intraperitoneally with the small-molecule angiogenic inhibitor sorafenib or with anti-vascular endothelial growth factor (VEGF) neutralizing antibody (six or eight mice per group). Expression of phospho-Smad2 and thrombospondin-1 was investigated immunologically in human gastric carcinoma tissues from 102 patients. All statistical tests were two-sided.

Results: Expression of dnTbetaRII into OCUM-2MLN cells did not affect their proliferation in vitro, but it accelerated the growth of subcutaneously or orthotopically transplanted tumors in vivo (eg, for mean volume of subcutaneous tumors on day 10 relative to that on day 0: dnTbetaRII tumors = 3.49 and GFP tumors = 2.46, difference = 1.02, 95% confidence interval [CI] = 0.21 to 1.84; P = .003). The tumors expressing dnTbetaRII had higher levels of angiogenesis than those expressing GFP because of decreased thrombospondin-1 production. Similar results were obtained with OCUM-12 cells. Expression of thrombospondin-1 in the dnTbetaRII tumor or treatment with sorafenib or anti-VEGF antibody reduced tumor growth, whereas knockdown of thrombospondin-1 expression resulted in more accelerated growth of OCUM-2MLN tumors than of GFP tumors (eg, mean tumor volumes on day 14 relative to those on day 0: thrombospondin-1-knockdown tumors = 4.91 and GFP tumors = 3.79, difference = 1.12, 95% CI = 0.80 to 1.44; P < .001). Positive association between phosphorylated Smad2 and thrombospondin-1 immunostaining was observed in human gastric carcinoma tissues.

Conclusions: Disruption of TGF-beta signaling in diffuse-type gastric carcinoma models appeared to accelerate tumor growth, apparently through increased tumor angiogenesis that was induced by decreased expression of thrombospondin-1.


Figures

Figure 1
Figure 1
Disruption of TGF-β in gastric cancer cells and tumors. We used parental OCUM-2MLN cells, 2MLN cells expressing GFP (termed 2MLN-GFP cells) as a control, and 2MLN cells expressing a dnTβRII (termed 2MLN-dnTβRII cells). A) TGF-β signal transduction in the cells. Immunoblot analysis was used to compare the level of phosphorylated Smad2 (phospho-Smad2) with that of Smad2 and 3 as control, in parental OCUM-2MLN cells (lanes – = cells carry no constructs), 2MLN-GFP cells (lanes GFP), and 2MLN-dnTβRII cells (lanes dnTβRII), treated with TGF-β3 (1 ng/mL) or left untreated for 1 hour. Expression of dnTβRII protein (by use of hemagglutinin [HA] tag), and that of GFP, as a control for lentiviral infection was also determined by immunoblot analysis. The cells were subjected to immunoblot analysis with antibodies against the proteins indicated to the left. The experiment was conducted two times, and data from one representative experiment are shown. B) Human Smad7 mRNA expression. Quantitative real-time polymerase chain reaction was used to assess the level of expression of human Smad7 mRNA in all three cell lines after treatment with TGF-β3 (1 ng/mL), as indicated. The experiment was conducted two times, each sample was assessed in triplicate, and data were averaged. Data from one representative experiment are shown. C) Proliferation of gastric cancer cells in the presence of TGF-β3. Cells were treated with TGF-β3 (1 ng/mL) in 10% fetal bovine serum for 3 days; control cells were not treated with TGF-β3. The experiment was conducted two times, each sample was assessed in triplicate, and data were averaged. Data from one representative experiment are shown. D) Growth of 2MLN-GFP and 2MLN-dnTβRII tumors in nude mice for 10 days. Cells were subcutaneously transplanted into nude mice (n = 8 mice per group). E) Growth of orthotopic 2MLN-GFP and 2MLN-dnTβRII tumors in nude mice. Cells were transplanted into the gastric wall of nude mice (n = 8 mice per group). Left) Macroscopic appearance of representative samples of excised gastric wall with an orthotopic tumor. Right) Relative areas of the 2MLN-GFP and 2MLN-dnTβRII tumors. Scale bar = 10 mm. Error bars = 95% confidence intervals. All P values (two-sided) were calculated by using a Student's t test, except for that in (D), which was calculated by using a two-way repeated measures analysis of variance. dnTβRII = dominant-negative TGF-β type II receptor; GFP = green fluorescent protein; TGF-β = transforming growth factor β.
Figure 2
Figure 2
Histological characterization of 2MLN-GFP and 2MLN-dnTβRII xenograft tumors from nude mice. A) Fibrotic tissue in subcutaneous 2MLN-GFP (GFP) or 2MLN-dnTβRII (dnTβRII) xenograft tumors. Left) On day 14, fibrotic areas of tumor sections were visualized by AZAN staining and examined via light microscopy. Scale bars = 100 μm. Right) Quantification of fibrotic areas (n = 9 with each condition). B) Expression of human and mouse procollagen I mRNAs. Left) 2MLN-GFP subcutaneous tumors in nude mice. Middle) 2MLN-dnTβRII subcutaneous tumors in nude mice. Right) TGF-β treatment in 2MLN-GFP and 2MLN-dnTβRII cell lines. Cells were treated with TGF-β for 24 hours or left untreated (as indicated) and assayed for procollagen I mRNA with quantitative real-time polymerase chain reaction. Each experiment was conducted two times, each sample was assessed in triplicate, and data were averaged. Data from one representative experiment of these are shown. C) Concentrations of human TGF-β1 protein in 2MLN-GFP and 2MLN-dnTβRII cell culture supernatants. The level of TGF-β1 protein was determined by an enzyme-linked immunosorbent assay with an antibody specific for TGF-β1. The experiment was conducted two times, each sample was assessed in triplicate, and data were averaged. Data from one representative experiment of these are shown. D) Vascular density in 2MLN-GFP and 2MLN-dnTβRII xenograft tumors. Vascular density was determined by immunostaining with an antibody against PECAM-1 (n = 6 mice per group). Left) Micrographs of immunostained 2MLN-GFP and 2MLN-dnTβRII xenograft tumor sections. PECAM-1–positive areas are shown in red (n = 6 with each condition). Scale bars = 100 μm. Right) Percent PECAM-1–positive areas in 2MLN-GFP and 2MLN-dnTβRII xenograft tumor sections per microscopic field (n = 6 with each condition). E) Expression of hTSP-1 mRNA. Left) 2MLN-GFP and 2MLN-dnTβRII tumors in nude mice. Right) 2MLN-GFP and 2MLN-dnTβRII cells treated with TGF-β or left untreated for 24 hours in vitro, as indicated. Each experiment was conducted two times, each sample was assessed in triplicate, and data were averaged. Data from one representative experiment are shown. Error bars = 95% confidence intervals. All P values (two-sided) were calculated with a Student's t test. dnTβRII = dominant-negative TGF-β type II receptor; GFP = green fluorescent protein; TGF-β = transforming growth factor β; hTSP-1 = human thrombospondin-1; PECAM-1 = platelet–endothelial cell adhesion molecule-1.
Figure 3
Figure 3
Characterization of xenograft tumors with a mixture of equal numbers of 2MLN-GFP (GFP) and 2MLN-dnTβRII (dnTβRII) cells. A) Developmental model of tumors inoculated with a mixture of 2MLN-GFP and 2MLN-dnTβRII. Equal amounts of the 2MLN-GFP and 2MLN-dnTβRII cells were mixed and transplanted into nude mice. The composition of tumors generated with a mixture of 2MLN-GFP and 2MLN-dnTβRII cells was compared with that of tumors generated with 2MLN-GFP or 2MLN-dnTβRII cells alone to investigate whether the tumor microenvironment serves as a major determinant of tumor growth. B) Distribution of 2MLN-GFP cells (GFP, green) and 2MLN-dnTβRII cells (as shown by a hemagglutinin tag that was detected with anti-hemagglutinin antibody, red) in mixed-cell tumors. 2MLN-GFP cells were identified by GFP fluorescence, and 2MLN-dnTβRII cells were identified by immunohistochemistry staining with an antibody specific for hemagglutinin and with nuclear counterstaining with TOTO-3. Left) Micrographs of sections from tumors generated with 2MLN-GFP cells alone, 2MLN-dnTβRII cells alone, or a mixture of both cell lines. Scale bars = 100 μm. Right) Percent hemagglutinin-positive areas and GFP-positive areas (n = 9 with each condition). C) Vascular areas in tumors generated with 2MLN-GFP cells alone, 2MLN-dnTβRII cells alone, or a mixture of both cell types. Vascular areas were identified by immunostaining with antibody against PECAM-1 (n = 3 in each condition). Error bars = 95% confidence intervals. All P values (two-sided) were calculated using the Student's t test. dnTβRII = dominant-negative TGF-β type II receptor; GFP = green fluorescent protein; TGF-β = transforming growth factor β; PECAM-1 = platelet–endothelial cell adhesion molecule-1.
Figure 4
Figure 4
Expression of TSP-1 and tumor growth in nude mice. A) Tumor volume and TSP-1 expression. The 2MLN-dnTβRII cells, which stably express TSP-1, are termed 2MLN-dnTβRII+TSP-1. Volumes of the subcutaneous tumors produced by 2MLN-GFP, 2MLN-dnTβRII, and 2MLN-dnTβRII+TSP-1 cells were determined 7 days after inoculation (n = 6 mice per group). B) Vascular density at 7 days after inoculation as determined by immunostaining for PECAM-1. Left) Immunostaining with antibody against PECAM-1. Scale bars = 100 μm. Right) Percent PECAM-1–positive area (n = 3 with each condition). C) Fibrotic tissue as determined by AZAN staining in the subcutaneous tumors 7 days after inoculation. Left) Micrographs with fibrotic tissue stained blue by AZAN staining. Scale bars = 100 μm. Right) Percent AZAN-positive area (n = 3 with each condition). D) The effect of miTSP-1 mRNA expression in the gastric cancer cells as determined by TSP-1 mRNA expression. The 2MLN-GFP, 2MLN-GFP+miTSP-1, and 2MLN-dnTβRII cells were treated with TGF-β or left untreated for 24 hours in vitro, and expression of TSP-1 mRNA was compared among the cell lines. The experiment was conducted two times, each sample was assayed in triplicate, and data were averaged. Data from one representative experiment are shown. E) Growth curves of 2MLN-GFP, 2MLN-GFP+miTSP-1, and 2MLN-dnTβRII xenograft tumors in nude mice (n = 6 in each condition). In 2MLN-GFP+miTSP-1 cells, the expression of TSP-1 was reduced by use of the miTSP-1. Tumor volume is shown relative to the average volume in each condition at day 0 after starting evaluation. F) Expression of TSP-1 mRNA in the 2MLN-GFP, 2MLN-GFP+miTSP-1, and 2MLN-dnTβRII tumors in vivo. Experiment was conducted two times, each sample was assessed in triplicate, and data were averaged. Data from one representative experiment are shown. Error bars = 95% confidence intervals. All P values (two-sided), except for those in (E), were calculated using the Student's t test. P values in (E) were calculated by two-way repeated measures analysis of variance. dnTβRII = dominant-negative TGF-β type II receptor; miTSP-1 = microRNA against thrombospondin-1; GFP = green fluorescent protein; TGF-β = transforming growth factor β; TSP-1 = thrombospondin-1; PECAM-1 = platelet–endothelial cell adhesion molecule-1.
Figure 5
Figure 5
Administration of sorafenib and tumor growth in nude mice. A) Growth curve of xenografted 2MLN-GFP and 2MLN-dnTβRII tumors and sorafenib treatment. Mice bearing tumors were treated with 800 μg of sorafenib or with vehicle, as indicated, every day for 14 days (n = 6 mice per group). The representative macroscopic appearance of the tumors at day 7 is shown in the bottom panels. B) Growth curve of xenografted 2MLN-GFP and 2MLN-dnTβRII tumors in the presence and absence of anti-VEGF neutralizing antibody (n = 6 mice per group). Mice bearing tumors were treated for 14 days with 50 μg of anti-VEGF antibody or vehicle, as indicated, twice a week. The representative macroscopic appearance of the tumors at day 7 is shown in the bottom panels. C) Expression of human TSP-1 mRNA and treatment with TGF-β. TSP-1 mRNA expression was determined by quantitative real-time reverse transcription–polymerase chain reaction in the control OCUM-12-GFP (GFP) and OCUM-12-dnTβRII (dnTβRII) cells that were treated with TGF-β (1 ng/mL) or left untreated for 24 hours in vitro. The experiment was conducted two times, each sample was assessed in triplicate, and data were averaged. Data from one representative experiment of these are shown. D) Growth curves of xenografted OCUM-12-GFP and OCUM-12-dnTβRII tumors and sorafenib treatment. Mice bearing tumors were treated with 800 μg of sorafenib or with vehicle, as indicated, every day for 14 days (n = 7 mice per group). The representative macroscopic appearance of the tumors at day 14 is shown in the bottom panels. Error bars = 95% confidence intervals. P values for (A), (B), and (D) were calculated by two-way repeated measures analysis of variance. Those for (C) were calculated with a Student's t test, two-sided. DMSO = dimethyl sulfoxide (vehicle). dnTβRII = dominant-negative TGF-β type II receptor; GFP = green fluorescent protein; VEGF = vascular endothelial growth factor; TGF-β = transforming growth factor β; TSP-1 = thrombospondin-1.

References

    1. Crew KD, Neugut AI. Epidemiology of gastric cancer. World J Gastroenterol. 2006;12(3):354–362. - PMC - PubMed
    1. Hohenberger P, Gretschel S. Gastric cancer. Lancet. 2003;362(9380):305–315. - PubMed
    1. Laurén P. The two histological main types of gastric carcinoma: diffuse and so-called intestinal-type carcinoma. Acta Pathol Microbiol Scand. 1965;64:31–49. - PubMed
    1. Yashiro M, Chung YS, Nishimura S, Inoue T, Sowa M. Establishment of two new scirrhous gastric cancer cell lines: analysis of factors associated with disseminated metastasis. Br J Cancer. 1995;72(5):1200–1210. - PMC - PubMed
    1. Henson DE, Dittus C, Younes M, Nguyen H, Albores-Saavedra J. Differential trends in the intestinal and diffuse types of gastric carcinoma in the United States, 19732000. Arch Pathol Lab Med. 2004;128(7):765–770. - PubMed

Publication types

MeSH terms