Comparative Study
. 2009 Apr 7;2(65):ra15.
doi: 10.1126/scisignal.2000199.

Spatiotemporal patterning during T cell activation is highly diverse

Affiliations
Comparative Study

Spatiotemporal patterning during T cell activation is highly diverse

Kentner L Singleton et al. Sci Signal. .

Abstract

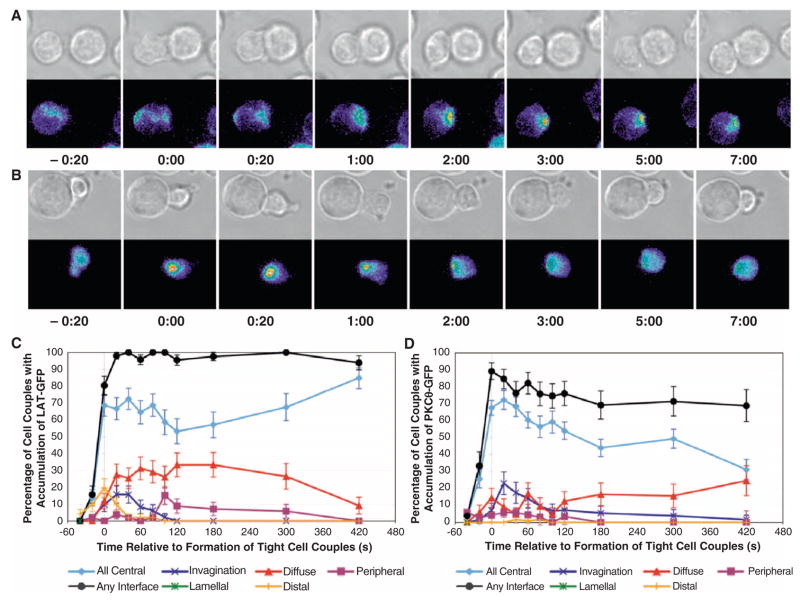
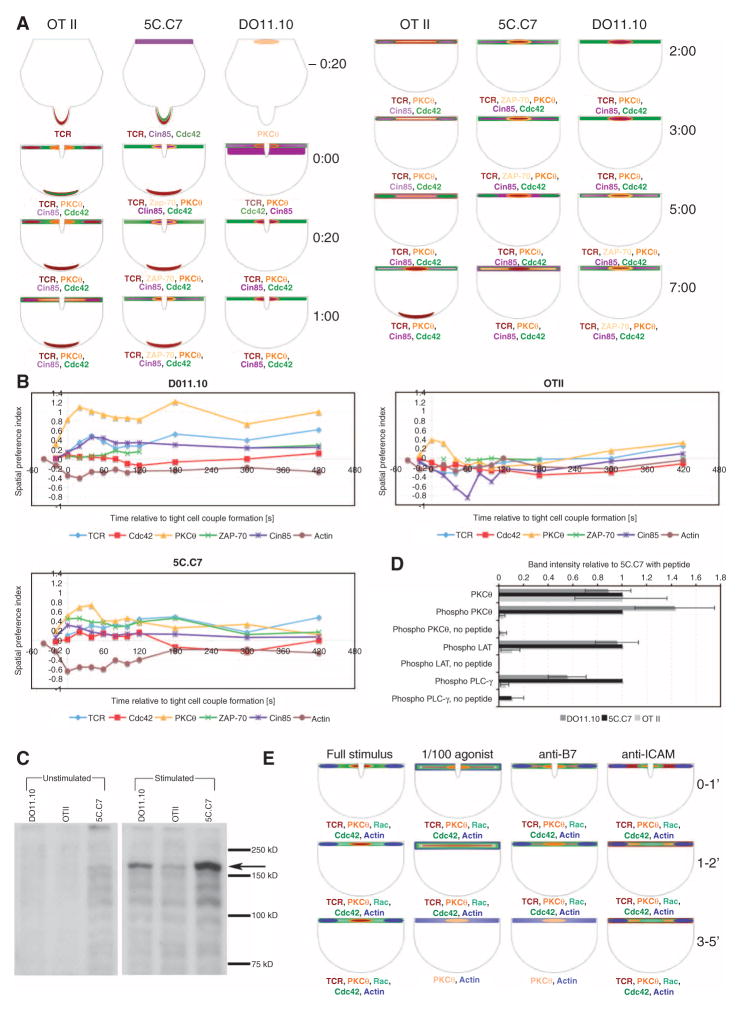
Temporal and spatial variations in the concentrations of signaling intermediates in a living cell are important for signaling in complex networks because they modulate the probabilities that signaling intermediates will interact with each other. We have studied 30 signaling sensors, ranging from receptors to transcription factors, in the physiological activation of murine ex vivo T cells by antigen-presenting cells. Spatiotemporal patterning of these molecules was highly diverse and varied with specific T cell receptors and T cell activation conditions. The diversity and variability observed suggest that spatiotemporal patterning controls signaling interactions during T cell activation in a physiologically important and discriminating manner. In support of this, the effective clustering of a group of ligand-engaged receptors and signaling intermediates in a joint pattern consistently correlated with efficient T cell activation at the level of the whole cell.


Figures

Fig. 1
Fig. 1
T cell–APC coupling triggers the rapid accumulation of sensors at the cellular interface in distinct patterns. Representative interactions of LAT-GFP–transduced (A) and PKCθ-GFP–transduced (B) 5C.C7 T cells with CH27 B cell lymphoma APCs in the presence of 10 μM MCC antigenic peptide (full stimulus) are shown at the indicated time points (in minutes) relative to the time of formation of a tight cell couple. Differential interference contrast (DIC) images are shown in the top rows, with top-down, maximum projections of three-dimensional LAT-GFP or PKCθ-GFP fluorescence data in the bottom rows. The LAT-GFP or PKCθ-GFP fluorescence intensities are displayed in a rainbow-like false-color scale (increasing from blue to red). Movies covering the entire time frame are available as movies S1 and S2, respectively. (C and D) The graphs display the percentage of cell couples that displayed accumulation of signaling intermediates with the indicated patterns (Fig. 2) relative to tight cell couple formation for T cells transduced with LAT-GFP (C) or PKCθ-GFP (D). Fifty-one cell couples were analyzed for the accumulation of LAT-GFP, whereas 111 cell couples were analyzed for the accumulation of PKCθ-GFP.
Fig. 2
Fig. 2
Spatiotemporal patterns of accumulation of sensors. Definitions of patterns, schematic representations, representative images, and associated supplementary movie files that prominently display the patterns are given. The en face view looks at the T cell–APC interface in the same way that an APC would. In the schemes, the outer gray circle delineates the entire interface, whereas the inner circle denotes its center. The top-down view looks down on the T cell from the top. In the schemes, the APC is not shown and would be on top of the T cell forming the flat T cell–APC interface.
Fig. 3
Fig. 3
Spatiotemporal patterning in T cell activation is highly diverse. In the interaction of primary 5C.C7 T cells with CH27 APCs in the presence of 10 μM MCC antigenic peptide the percentage occurrence of each of the six accumulation patterns (as defined in Fig. 2) was determined for 12 time points (Fig. 1) for 30 molecules involved in T cell activation (Table 1). Raw pattern analysis data are given in fig. S6. Here, patterns are graphically represented at 8 of the 12 time points analyzed as indicated at the right side of the panels in minutes. Gray denotes the outline of the T cell; the APC is not shown, but would be on top of the T cell. A large T cell invagination (43) is shown at early time points. Each signaling component of T cell activation is denoted by a unique, random color. To avoid crowding of panels, the 28 signaling components displayed were split into six panels at each time point. At each time point, the dominant accumulation pattern of a sensor was determined as described in the supplementary methods and is displayed in light or dark shades of that sensor’s color according to its dominance. If more than one sensor displays the same dominant pattern in a given panel, sensors are displayed as concentric pattern symbols in random order. An average of 53 cell couples (from a total of 1650 cell couples) were analyzed for each sensor (table S2).
Fig. 4
Fig. 4
Cluster analysis of spatiotemporal patterning. Cluster analysis of the data presented in Fig. 3 and fig. S6 based on the five mutually exclusive interface patterns [central (C), invagination (Inv), diffuse (D), peripheral (P), and lamellum (L); Fig. 2] is given. The percentage occurrence of each pattern is given in shades of red from C-40 to L420 in the top part of the figure. In addition, to address the rate of pattern change, the percentage change per 20-s interval was tabulated (C-40 to L300 in the bottom part of the figure). Red indicates an increase and green a decrease in the percentage occurrence of a pattern relative to the previous time point. Cluster analysis based on Pearson’s correlation was performed on the entire data set and the cluster tree is given in pink. To assess reliability in the determination of pattern similarities, TCR clustering was determined with three sensors. ‘TCR’ refers to TCRζ-GFP, ‘TCR eng’ to ligand-engaged TCR, as determined by MHC II–GFP binding, and CD3e to CD3ε-GFP. The spatiotemporal patterns of these three TCR sensors were closely related, indicating high reliability in pattern determination. Relationships between signaling intermediates were not substantially changed by either including distal accumulation patterns or removing rates of pattern change (fig. S11), thus supporting the robust nature of the cluster analysis.
Fig. 5
Fig. 5
Formation of the cSMAC signaling complex is related to the efficiency of T cell signaling. (A) Spatiotemporal patterning of a subset of indicated sensors in the interaction of primary DO11.10, OTII, and 5C.C7 T cells with professional APCs in the presence of a 10 μM antigenic peptide is displayed similarly to that in Fig. 3. Raw pattern analysis data and data statistics are given in fig. S12. (B) The spatial preference index as defined in the supplementary methods is given for the data in (A) to illustrate differential centrality of patterning. (C and D) DO11.10, OTII, and 5C.C7 T cells, as indicated, were stimulated by professional APCs as described above in the presence of 10 μM antigenic peptide in a cell pellet for 5 min. As a control, antigenic peptide was omitted (“unstimulated”). T cell–APC extracts were analyzed by Western blotting for the presence of LAT-Y191, PLC-γ-Y783, and PKCθ-T538, as indicated. In (C), a representative blot for PLC-γ-Y783 (arrow) is shown. Both parts of the panel are derived from the same blot; with only the intermittent, unrelated lanes removed. In (D), band intensities relative to the 5C.C7 band for all blots are given with their standard errors. (E) Spatiotemporal patterning of a subset of indicated sensors in the interaction of primary 5C.C7 T cells with professional CH27 APCs under varying conditions of T cell activation conditions, as noted, is displayed similarly to that in Fig. 3. Raw pattern analysis data for hitherto unpublished data and data statistics are given in fig. S14.

References

    1. Kavran JM, Klein DE, Lee A, Falasca M, Isakoff SJ, Skolnik EY, Lemmon MA. Specificity and promiscuity in phosphoinositide binding by pleckstrin homology domains. J Biol Chem. 1998;273:30497–30508. - PubMed
    1. Songyang Z, Shoelson SE, Chaudhuri M, Gish G, Pawson T, Haser WG, King F, Roberts T, Ratnofsky S, Lechleider RJ, Neel BG, Birge RB, Fajardo JE, Chou MM, Hanafusa H, Schaffhausen B, Cantley LC. SH2 domains recognize specific phosphopeptide sequences. Cell. 1993;72:767–778. - PubMed
    1. Feng S, Kasahara C, Rickles RJ, Schreiber SL. Specific interactions outside the proline-rich core of two classes of Src homology 3 ligands. Proc Natl Acad Sci USA. 1995;92:12408–12415. - PMC - PubMed
    1. Pawson T, Nash P. Assembly of cell regulatory systems through protein interaction domains. Science. 2003;300:445–452. - PubMed
    1. Alexander RT, Furuya W, Szászi K, Orlowski J, Grinstein S. Rho GTPases dictate the mobility of the Na/H exchanger NHE3 in epithelia: Role in apical retention and targeting. Proc Natl Acad Sci USA. 2005;102:12253–12258. - PMC - PubMed

Publication types

MeSH terms

Substances

LinkOut - more resources