Review
. 2009 May;10(5):360-72.
doi: 10.1038/nrn2619. Epub 2009 Apr 8.

Parallel processing strategies of the primate visual system

Affiliations
Review

Parallel processing strategies of the primate visual system

Jonathan J Nassi et al. Nat Rev Neurosci. 2009 May.

Abstract

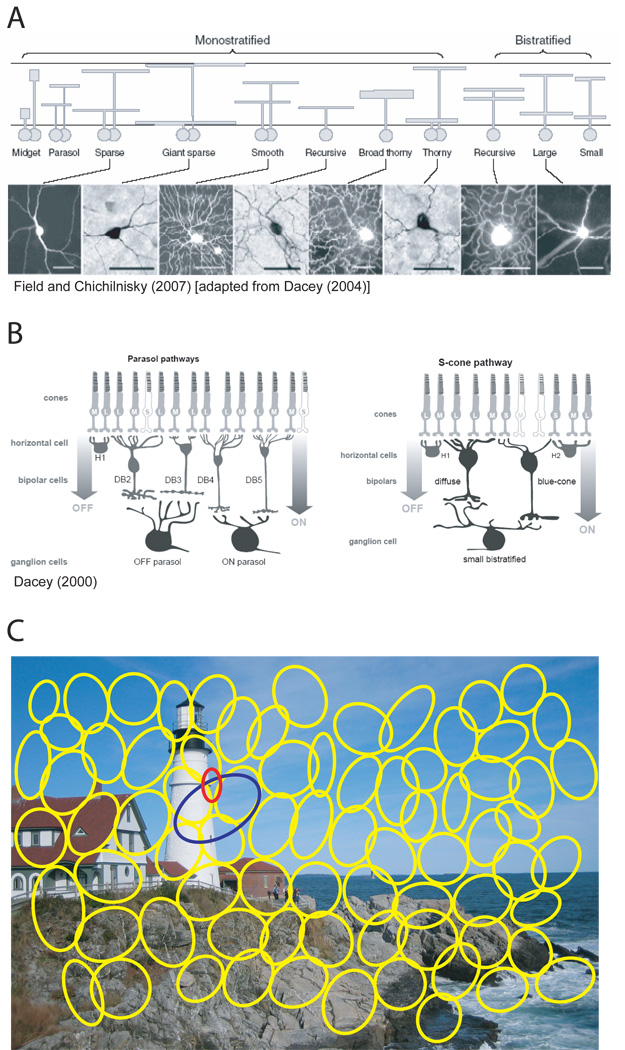
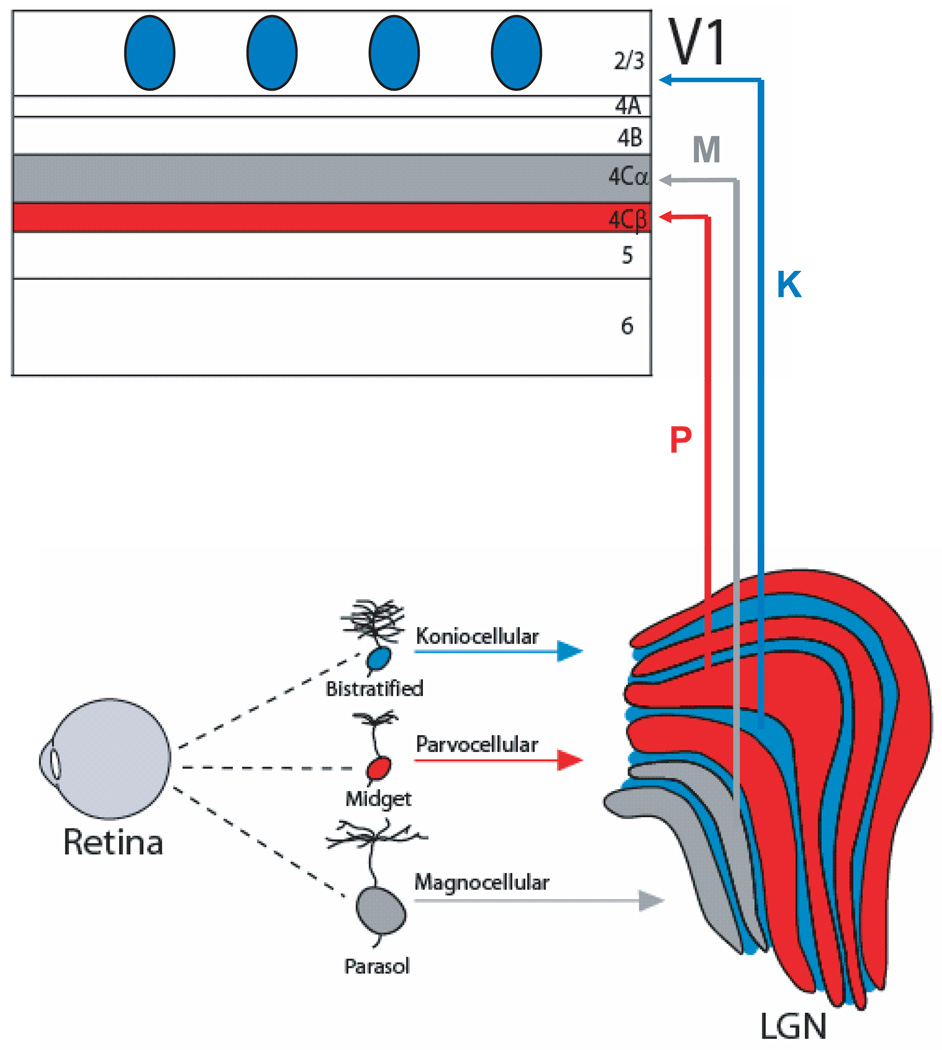
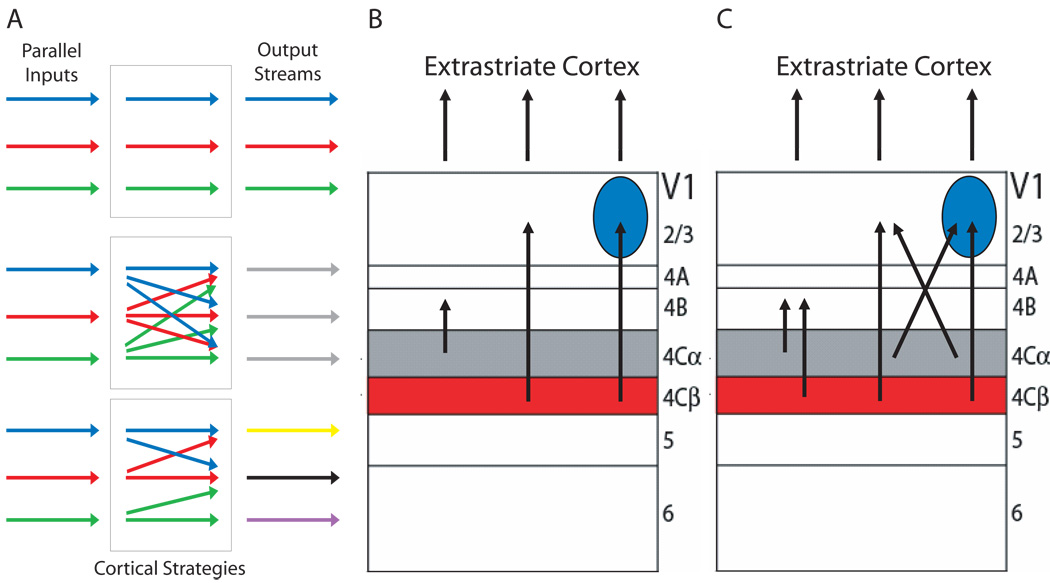
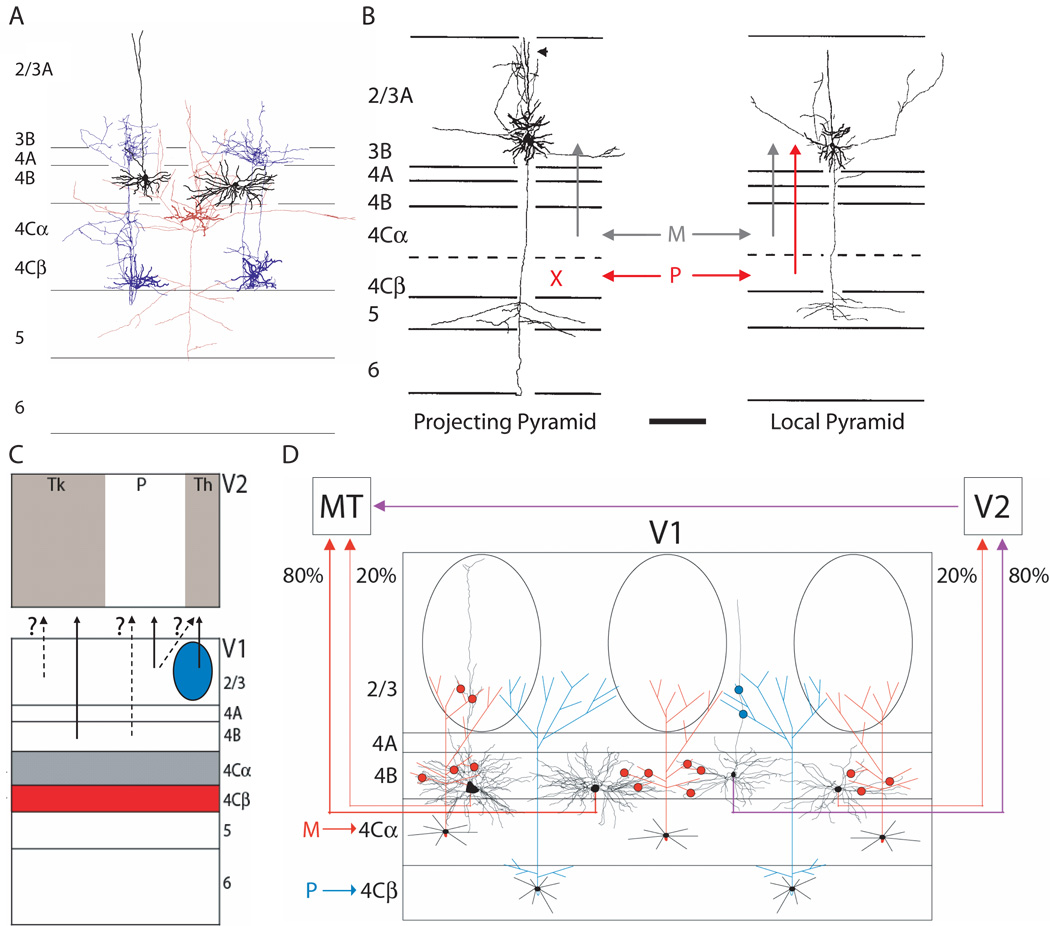
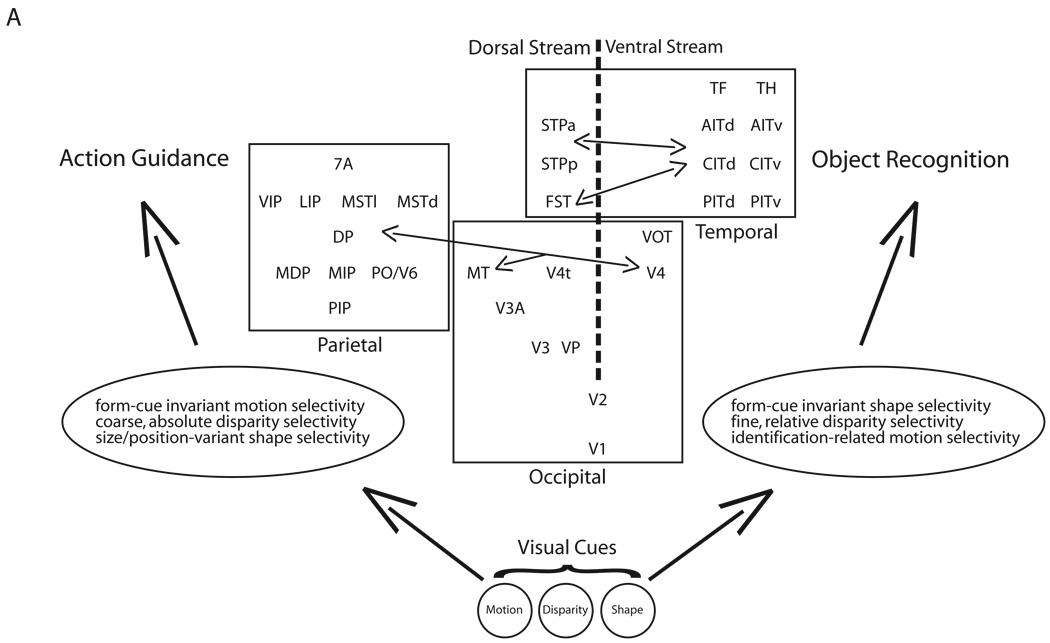
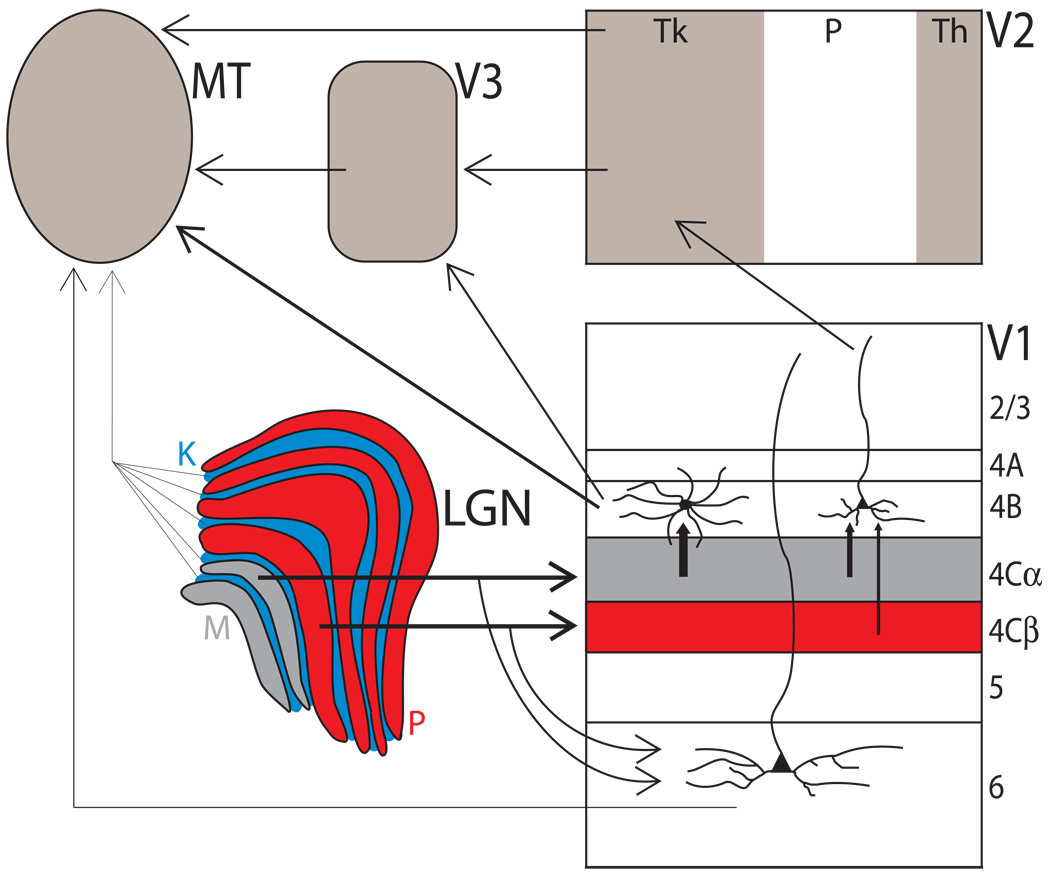
Incoming sensory information is sent to the brain along modality-specific channels corresponding to the five senses. Each of these channels further parses the incoming signals into parallel streams to provide a compact, efficient input to the brain. Ultimately, these parallel input signals must be elaborated on and integrated in the cortex to provide a unified and coherent percept. Recent studies in the primate visual cortex have greatly contributed to our understanding of how this goal is accomplished. Multiple strategies including retinal tiling, hierarchical and parallel processing and modularity, defined spatially and by cell type-specific connectivity, are used by the visual system to recover the intricate detail of our visual surroundings.


Figures

Figure 1
Figure 1. Parallel processing in the retina
(A) Over a dozen different ganglion cell types exist in the retina, each with their own distinct set of morphological features including soma size, dendritic-field size and density, and level of stratification within the inner plexiform layer (IPL). Top panel shows schematic cross-sectional representation of morphologically distinct retinal ganglion cell types exhibiting either monostratified or bistratified dendritic arborization in the IPL; the boundaries of the IPL are indicated schematically by horizontal lines. The vertical position of each schematic dendritic arbor indicates its characteristic stratification in the IPL. Lower panel shows top views of filled cells obtained using retrograde photostaining from rhodamine dextran injections in the LGN and superior colliculus; scale bar is 50µm. (B) Each ganglion cell type, such as parasol (left) or small bistratified (right) have a unique set of inputs from photoreceptor cells, horizontal cells, bipolar and amacrine cells. These retinal sub-circuits confer specialized physiological response properties to the ganglion cells. (C) The receptive field mosaic of an actual population of ON-parasol ganglion cells (yellow; from Field and Chichilnisky (2007)) is overlayed on an example visual scene, not drawn to scale. Missing cells in the mosaic are likely to reflect experimental undersampling rather than gaps in the retinal representation. Each ganglion cell type tiles the retina so that at any given point in the visual field, multiple ganglion cell types (red, blue, and yellow ellipses) are present and signal complementary visual information simultaneously and in parallel to the brain. (A) Obtained from Field and Chichilnisky (2007), which was originally adapted from Dacey (2004).
Figure 2
Figure 2. Parallel pathways from retina to cortex
Midget, parasol and bistratified ganglion cells are well characterized and have been linked to parallel pathways that remain anatomically separate and distinct through the lateral geniculate nucleus (LGN) and into primary visual cortex (V1). Parasol ganglion cells project to magnocellular (M) layers of the LGN and on to layer 4Cα of V1 (gray). Midget ganglion cells project to parvocellular (P) layers of the LGN and on to layer 4Cβ of V1 (red). Small and large bistratified ganglion cells project to koniocellular (K) layers of the LGN and on to the cytochrome oxidase expressing patches (or blobs) of layer 2/3 (blue). Although these ganglion cell types are numerically dominant within the retina, many more types are known to exist and are likely to subserve important parallel pathways that are yet to be identified.
Figure 3
Figure 3. Cortical processing strategies
(A) Multiple strategies might be used by a visual cortical area (rectangles) in order to transform parallel inputs (arrows to the left of rectangles) into multiple outputs (arrows to the right of rectangles). One possibility (top) is that segregation of inputs is maintained (arrows within top rectangle) and passed directly on to the outputs. A second possibility (middle) is that these inputs mix indiscriminately (arrows within middle rectangle) and bear no systematic relationship to the outputs. A third possibility (bottom) is that the parallel inputs converge in an organized and specific way (arrows within bottom rectangle) so as to form the basis for specialized outputs. (B) Early models of V1 proposed that M and P pathway inputs remained segregated within V1 as they passed through layers 4B and 2/3 respectively and on to extrastriate cortex. (C) Recent studies have provided evidence for extensive intermixing and convergence of M, P and K pathway inputs, suggesting that V1 outputs bear little or no systematic relationship to its parallel inputs. Cytochrome oxidase-expressing blobs are shown as blue circles.
Figure 4
Figure 4. Spatial and cell type-specific connectivity in V1
(A) Layer 4B of V1 contains two excitatory cell types known as pyramidal (black, left) and stellate (black, right). Both of these cell types receive direct input from cells in M-dominated layer 4Cα (red), but only pyramids have apical dendrites that pass above layer 4B and into layer 2/3. The apical dendrites of these pyramids are in a position to receive inputs from P-dominated layer 4Cβ projections into layer 2/3 (blue). Mixed M and P inputs onto pyramids and M only inputs onto stellates has been confirmed in photostimulation studies on macaque monkey V1 slices. (B) Layer 3B contains pyramidal cells that project out of V1 (projecting pyramid) and those that remain within V1 (local pyramid). Projecting pyramids (left) receive input only from M-dominated layer 4Cα (gray arrow), whereas local pyramids receive mixed input from both M-dominated layer 4Cα and P-dominated layer 4Cβ (red arrow). Red X denotes lack of input from layer 4Cβ. (C) Outputs from V1 to V2 were originally thought to maintain strict segregation, with layer 4B of V1 projecting to the cytochrome oxidase (CO)-stained thick stripes of V2, and the CO blobs and interblobs of layer 2/3 projecting to the thin and pale stripes of V2, respectively (arrows). This spatial modularity of outputs has recently been called into question with evidence that layer 2/3 blobs and interblobs in V1 provide substantial input to the thin stripes in V2, and that all projection layers underneath interblobs, including layer 4B, project to both thick and/or pale stripes (dashed arrows with question marks). (D) Specialized and distinct populations of cells project from layer 4B of V1 to area MT (middle temporal, also known as visual area V5) or V2. Area MT receives input from a population of cells with large cell bodies and dense dendritic trees. The majority of these cells are stellates (80%), but a smaller number of pyramids (20%) also project to MT and are positioned preferentially underneath CO blobs where their apical dendrites can receive M inputs from layer 4Cα (red circles). V2 receives input from a population of cells with smaller cell bodies and sparse dendritic trees, the majority of which are pyramidal. Together, these anatomical specializations are consistent with layer 4B of V1 relaying a quick, M-dominated signal to MT and a more mixed M and P signal to V2.
Figure 5
Figure 5. Parallel processing streams of extrastriate cortex
Dorsal (left of vertical, dotted line) and ventral (right of vertical, dotted line) streams constitute separate but interconnected pathways through occipital, parietal and temporal extrastriate visual cortex (rectangular boundaries). Vertical position indicates the hierarchical relationship between areas. Interconnections between streams can be found at essentially every level of the hierarchy. For simplicity, not all areas have been included and only those cross-stream connections mentioned in the text have been drawn. Dorsal and ventral processing streams subserve different behavioural goals, with the dorsal stream aimed at the visual control of skilled actions and the ventral stream aimed at object recognition. The very same sensory cues, such as motion, disparity and shape are processed along both processing streams, but within each stream distinct computations are performed on these same cues in order to support different behavioural goals. V1,Visual area 1; V2, visual area 2; V3, visual area 3; VP, ventral posterior; V3A, visual area 3A; MT, middle temporal; V4, visual area 4; V4t, visual area 4 transitional; VOT, ventral occipitotemporal; FST, fundus of superior temporal; PITd, posterior inferotemporal (dorsal); PITv, posterior inferotemporal (ventral); CITd, central inferotemporal (dorsal); CITv, central inferotemporal (ventral); AITd, anterior inferotemporal (dorsal); AITv, anterior inferotemporal (ventral); STPp, superior temporal polysensory (posterior); STPa, superior temporal polysensory (anterior); TF, temporal area F; TH, temporal area H; MSTd, medial superior temporal (dorsal); MSTl, medial superior temporal (lateral); PO, parieto-occipital; V6, visual area 6; PIP, posterior intraparietal; VIP, ventral intraparietal; LIP, lateral intraparietal; MIP, medial intraparietal; MDP, medial dorsal parietal; DP, dorsal prelunate; 7a, visual area 7a.
Figure 6
Figure 6. Multiple input streams to area MT
Multiple input streams exist from the lateral geniculate nucleus (LGN) to the middle temporal (MT) area. The major ascending input to MT passes through M layers of the LGN, and layers 4Cα and 4B of V1. V2 and V3 provide indirect inputs from layers 4Cα and 4B of V1, with V2 probably providing inputs from layer 4Cβ after a small number of additional synapses. Bypassing layer 4C altogether, a sparse monosynaptic projection from K cells in the LGN to MT and a disynaptic projection from M and P layers of the LGN through layer 6 Meynert cells in V1 to MT have both been identified, . Area MT is likely to use similar strategies to those found in V1 in order to process these parallel inputs and transform their signals into multiple output streams. The thickness of each arrow represents the strength of the connection. Tk, thick; Th, thin; P, pale.

References

    1. Gasser HS, Erlanger J. The role of fiber size in the establishment of a nerve block by pressure or cocaine. Am. J. Physiol. 1929;88:581–591.
    1. Bishop GH. Fiber groups in the optic nerves. Am. J. Physiol. 1933;106:460–470.
    1. Callaway EM. Structure and function of parallel pathways in the primate early visual system. J Physiol. 2005;566:13–19. - PMC - PubMed
    1. Goodale MA, Milner AD. Separate visual pathways for perception and action. Trends Neurosci. 1992;15:20–25. - PubMed
    1. Hendry SH, Reid RC. The koniocellular pathway in primate vision. Annu Rev Neurosci. 2000;23:127–153. - PubMed

Publication types