. 2009;4(4):e5062.
doi: 10.1371/journal.pone.0005062. Epub 2009 Apr 7.

The nucleus accumbens: a switchboard for goal-directed behaviors

Affiliations

The nucleus accumbens: a switchboard for goal-directed behaviors

Aaron J Gruber et al. PLoS One. 2009.

Abstract

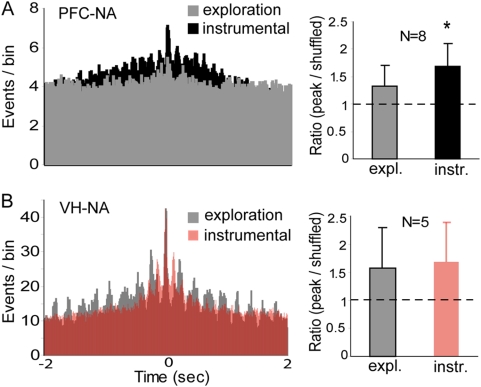
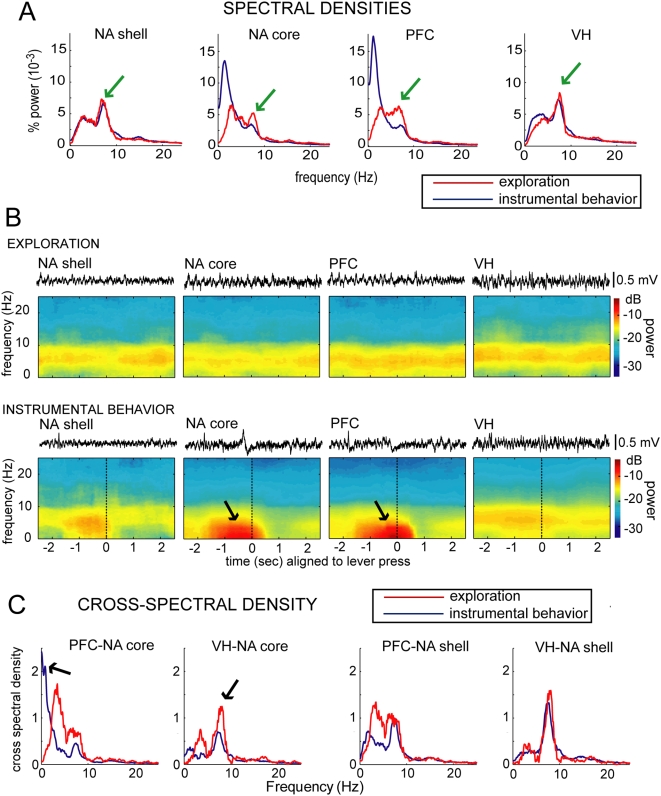
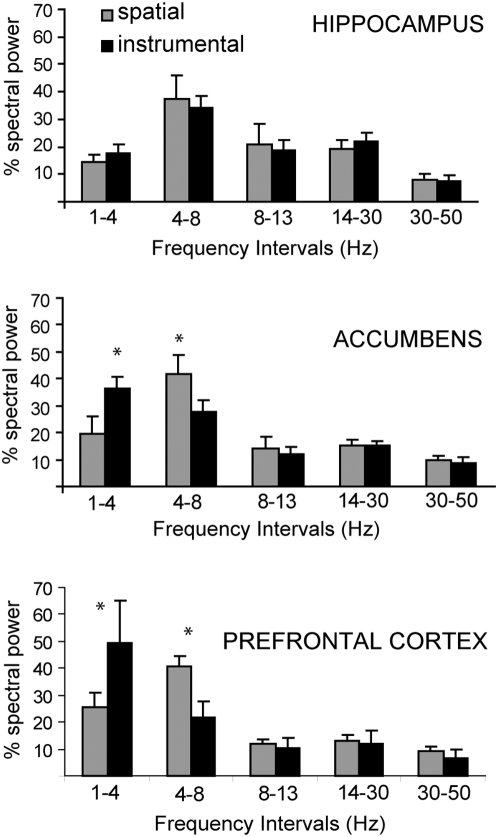
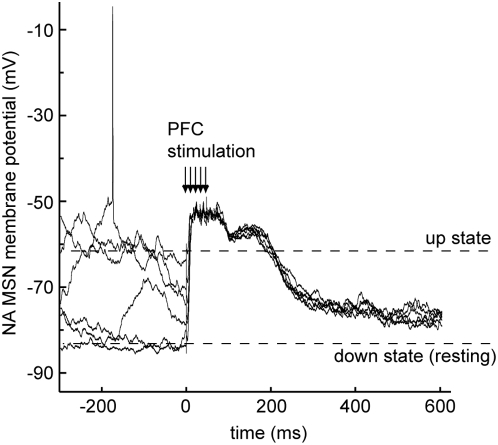
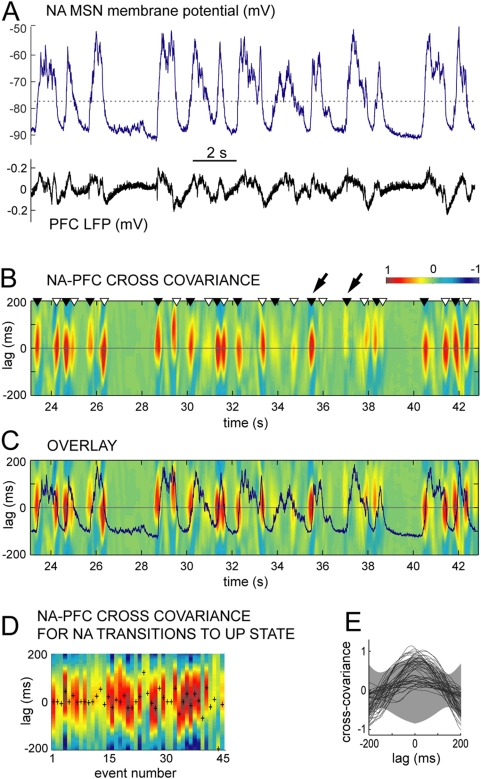
Reward intake optimization requires a balance between exploiting known sources of rewards and exploring for new sources. The prefrontal cortex (PFC) and associated basal ganglia circuits are likely candidates as neural structures responsible for such balance, while the hippocampus may be responsible for spatial/contextual information. Although studies have assessed interactions between hippocampus and PFC, and between hippocampus and the nucleus accumbens (NA), it is not known whether 3-way interactions among these structures vary under different behavioral conditions. Here, we investigated these interactions with multichannel recordings while rats explored an operant chamber and while they performed a learned lever-pressing task for reward in the same chamber shortly afterward. Neural firing and local field potentials in the NA core synchronized with hippocampal activity during spatial exploration, but during lever pressing they instead synchronized more strongly with the PFC. The latter is likely due to transient drive of NA neurons by bursting prefrontal activation, as in vivo intracellular recordings in anesthetized rats revealed that NA up states can transiently synchronize with spontaneous PFC activity and PFC stimulation with a bursting pattern reliably evoked up states in NA neurons. Thus, the ability to switch synchronization in a task-dependent manner indicates that the NA core can dynamically select its inputs to suit environmental demands, thereby contributing to decision-making, a function that was thought to primarily depend on the PFC.


Conflict of interest statement

Competing Interests: The authors have declared that no competing interests exist.

Figures

Figure 1
Figure 1. PFC-NA unit correlation is strengthened during bar press for a natural reward.
(A) Representative cross-correlograms of a NA-PFC neuron pair (referenced to PFC firing at time 0) when the animal was exploring (gray) and during bar pressing for sucrose (black). Right: bar graphs showing the ratio between the crosscorrelogram peak and a similar analysis of shuffled recordings from the same pairs for both behavioral conditions. Mean±SD; * p<0.05 by paired t test. (B) Similar cross-correlation of a representative VH-NA pair during exploration (gray) and bar pressing (red). No differences were observed in these cases.
Figure 2
Figure 2. Dominant frequencies in the VH, NA and PFC field potentials differ between exploration and goal-directed behavior.
(A) Normalized spectral densities in the NA shell, NA core, PFC and VH obtained from simultaneously recorded epochs (4 seconds) in which the animals were exploring the cage (red line). The epochs were selected to match the location and body orientation of the operant task. The blue line represents the normalized spectral densities for the same four locations but during 4 second epochs in which the rats were lever-pressing for sucrose (2 seconds prior and after the lever press). The graphs were constructed with data from 6 sessions in 5 rats for the NA core, and 2 sessions in 2 rats for the NA shell (all of them with simultaneous recordings in the PFC and VH). Strong theta peaks are evident in all regions during exploration (green arrows), but they are lost in the NA core and PFC during the instrumental behavior. An increase in delta activity can be observed instead. (B) Pseudocolor plots of relative spectral power in the NA shell, NA core, PFC and VH during a 5-second epoch in which rats were exploring (top) and during a 5-second epoch centered on the lever press when the animals were engaged in instrumental behavior (bottom). The LFP traces of one of the epochs included in the analyses are shown above each box. Event-triggered and exploration spectrograms were constructed from one session from each animal and the display is the averaged data of all animals, revealing a strong theta oscillation during exploration, which weakens in the NA core and PFC (but not in the NA shell and VH) during lever-pressing. The NA core and PFC show instead strong activity in the delta range (arrows), which are driven by slow deflections that can be observed in the traces above. (D) Cross-spectral densities were calculated to determine coherence between similar frequency peaks in LFP obtained simultaneously from different brain regions during exploration and instrumental behavior. The two leftward panels illustrate representative pairings of PFC and NA core, and VH and NA core while the rat was exploring (red line), revealing a high coherence in the theta range between VH and NA core (arrow in second panel from left). The blue line in both panels are cross-spectral densities in the same pairs when the rat was bar pressing for sucrose in the same session, showing a peak in the delta range between NA core and PFC (arrow in left panel). The two rightward panels illustrate cross-spectral densities between the NA shell and PFC and VH in the same rat and session. A strong theta peak is present in the shell-VH cross-spectrum independently of the behavioral condition.
Figure 3
Figure 3. Weight of spectral bands during spatial exploration and goal-directed behavior.
Bar graphs depicting summed power for the 1–4 Hz (delta), 4–8 Hz (theta), 8–14 Hz (alpha), 14–30 (beta), and 30–50 (gamma) bands. Gray bars show the weight of each band during spatial exploration and black bars represent band weight during goal-directed behavior. Top to bottom graphs illustrate spectral bands from all accumbens core, hippocampal, and PFC recordings.
Figure 4
Figure 4. PFC stimulation with trains of pulses evokes persistent depolarizations in NA neurons.
Overlay of six traces obtained from a NA neuron during in vivo intracellular recording from an anesthetized rat, showing the membrane potential responses to stimulating the PFC with a train of 5 pulses at 50 Hz (arrows indicate the stimulation times; stimulus artifacts were removed for clarity). The traces were selected to display stimuli delivered during both up and down states, and in either case a sustained depolarization was observed.
Figure 5
Figure 5. Cross-covariance analysis of intracellular NA neuron membrane potential and PFC LFP in anesthetized rats.
(A) Simultaneous recording of intracellular membrane potential of a NA medium spiny neuron (MSN; top) and PFC field potential (LFP; bottom) showing spontaneous oscillations typical of an anesthetized rat. Transitions of MSN membrane potential between a hyperpolarized down state and depolarized up states are detected with a threshold (dotted line). (B) Pseudocolor plot of the cross covariance of these traces with a ±200 ms time lag window (ordinate). MSN membrane potential transitions from down to up states are indicated by dark triangles, and up-to-down transitions with white triangles. Oblique arrows point to two consecutive up state onsets showing high covariance (left) and no covariance (right) with PFC LFP. (C) Overlay of the cross covariance plot in B and the MSN membrane potential trace in A showing the high covariance epochs to correspond to state transitions. (D) Cross covariance at successive down-to-up state transitions from data in A, showing that both the magnitude and lag of the peak cross-covariance (indicated by ‘+’) vary in time. Transitions that co-vary with PFC LFP are interspersed with those that do not co-vary. (E) Cross covariance in B plotted in time and superimposed with mean±standard deviation of cross covariance computed from randomized versions of the traces in A (gray region). Cross-covariance near lag = 0 shows the data clustered in two populations: a significantly covariant set of events and others with almost no covariance.

References

    1. Fuster JM. The Prefrontal Cortex. Anatomy, Physiology, and Neuropsychology of the frontal lobe. New York: Lippincott-Raven; 1997. p. 333.
    1. Christakou A, Robbins TW, Everitt BJ. Prefrontal cortical-ventral striatal interactions involved in affective modulation of attentional performance: implications for corticostriatal circuit function. J Neurosci. 2004;24:773–780. - PMC - PubMed
    1. Haddon JE, Killcross S. Prefrontal cortex lesions disrupt the contextual control of response conflict. J Neurosci. 2006;26:2933–2940. - PMC - PubMed
    1. Daw ND, O'Doherty JP, Dayan P, Seymour B, Dolan RJ. Cortical substrates for exploratory decisions in humans. Nature. 2006;441:876–879. - PMC - PubMed
    1. Grace AA, Floresco SB, Goto Y, Lodge DJ. Regulation of firing of dopaminergic neurons and control of goal-directed behaviors. Trends Neurosci. 2007;30:220–227. - PubMed

Publication types

LinkOut - more resources