. 2009;4(4):e5108.
doi: 10.1371/journal.pone.0005108. Epub 2009 Apr 8.

A compartment model of VEGF distribution in humans in the presence of soluble VEGF receptor-1 acting as a ligand trap

Affiliations

A compartment model of VEGF distribution in humans in the presence of soluble VEGF receptor-1 acting as a ligand trap

Florence T H Wu et al. PLoS One. 2009.

Abstract

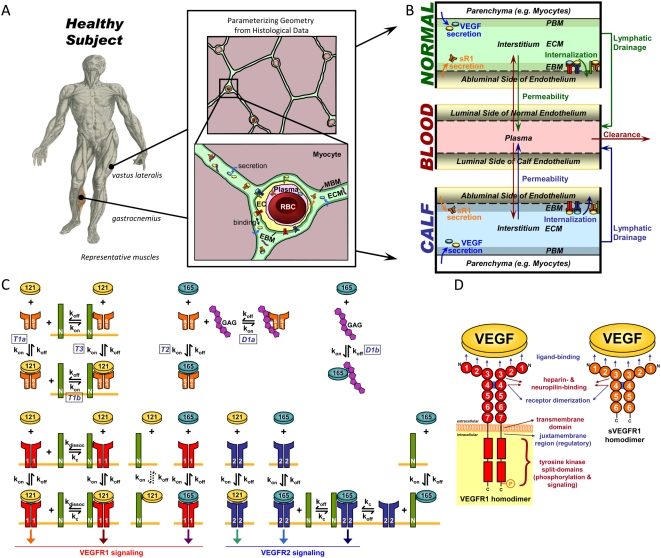
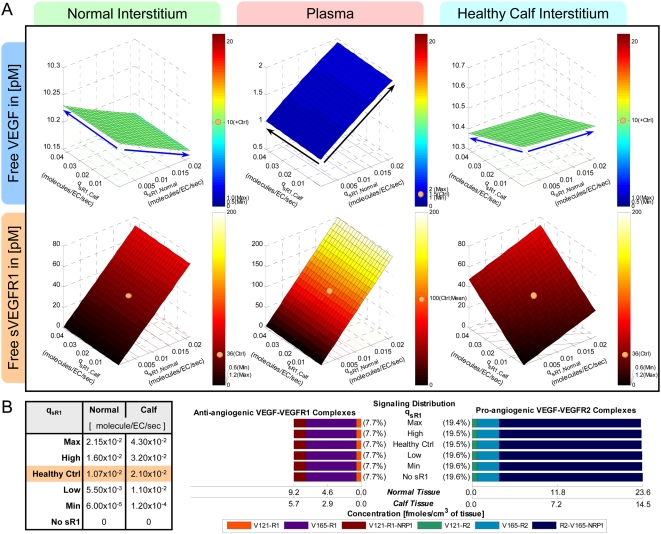
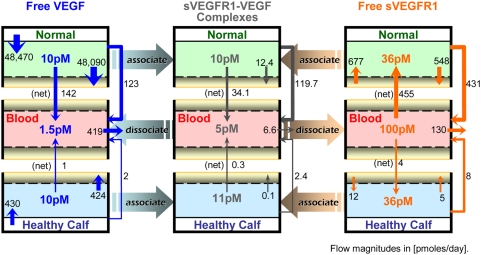
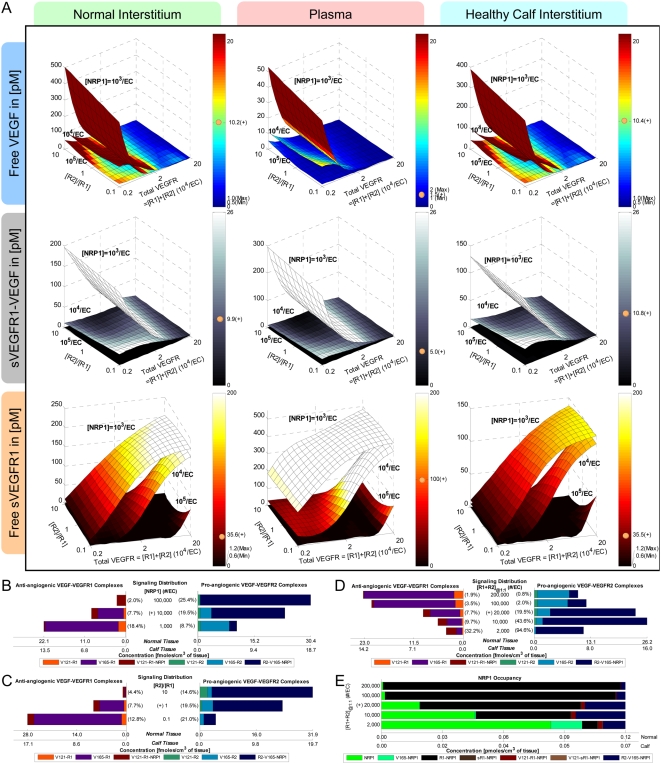
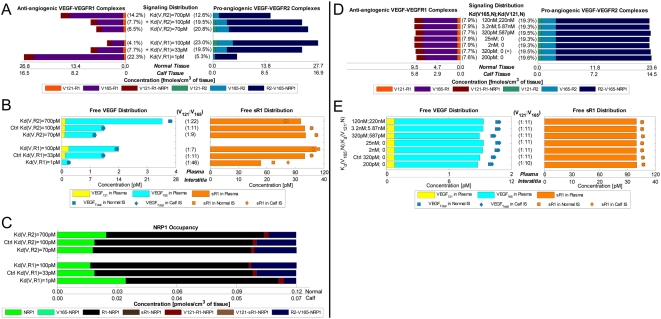
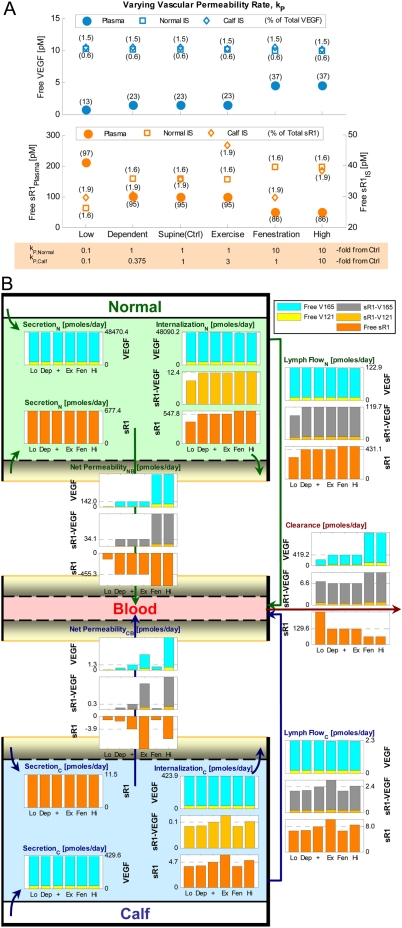
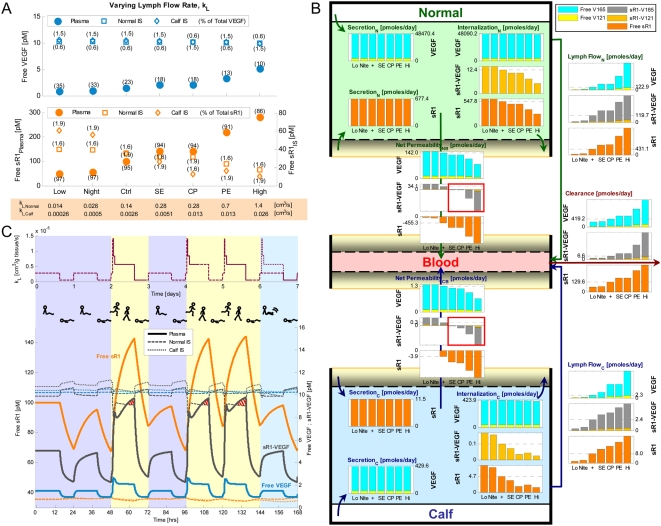
Vascular endothelial growth factor (VEGF), through its activation of cell surface receptor tyrosine kinases including VEGFR1 and VEGFR2, is a vital regulator of stimulatory and inhibitory processes that keep angiogenesis--new capillary growth from existing microvasculature--at a dynamic balance in normal physiology. Soluble VEGF receptor-1 (sVEGFR1)--a naturally-occurring truncated version of VEGFR1 lacking the transmembrane and intracellular signaling domains--has been postulated to exert inhibitory effects on angiogenic signaling via two mechanisms: direct sequestration of angiogenic ligands such as VEGF; or dominant-negative heterodimerization with surface VEGFRs. In pre-clinical studies, sVEGFR1 gene and protein therapy have demonstrated efficacy in inhibiting tumor angiogenesis; while in clinical studies, sVEGFR1 has shown utility as a diagnostic or prognostic marker in a widening array of angiogenesis-dependent diseases. Here we developed a novel computational multi-tissue model for recapitulating the dynamic systemic distributions of VEGF and sVEGFR1. Model features included: physiologically-based multi-scale compartmentalization of the human body; inter-compartmental macromolecular biotransport processes (vascular permeability, lymphatic drainage); and molecularly-detailed binding interactions between the ligand isoforms VEGF(121) and VEGF(165), signaling receptors VEGFR1 and VEGFR2, non-signaling co-receptor neuropilin-1 (NRP1), as well as sVEGFR1. The model was parameterized to represent a healthy human subject, whereupon we investigated the effects of sVEGFR1 on the distribution and activation of VEGF ligands and receptors. We assessed the healthy baseline stability of circulating VEGF and sVEGFR1 levels in plasma, as well as their reliability in indicating tissue-level angiogenic signaling potential. Unexpectedly, simulated results showed that sVEGFR1 - acting as a diffusible VEGF sink alone, i.e., without sVEGFR1-VEGFR heterodimerization--did not significantly lower interstitial VEGF, nor inhibit signaling potential in tissues. Additionally, the sensitivity of plasma VEGF and sVEGFR1 to physiological fluctuations in transport rates may partially account for the heterogeneity in clinical measurements of these circulating angiogenic markers, potentially hindering their diagnostic reliability for diseases.


Conflict of interest statement

Competing Interests: The authors have declared that no competing interests exist.

Figures

Figure 1
Figure 1. Schematic of Multi-Tissue Model of VEGF and sVEGFR1 Distributions.
A. Whole-body compartmentalization of solid tissues into ‘Calf’ vs. ‘Normal’ (rest of the body) compartments for a healthy subject. Characteristic geometries – parenchymal cell (grayish red), interstitial space (green/blue) and capillary space (endothelial cells (EC) in yellow, plasma in pink, red blood cells (RBC) in red) volume fractions; basement membrane (BM) thicknesses; and EC surface areas – were quantified from histological cross-sections of representative human skeletal muscles (gastrocnemius and vastus lateralis). Illustrations adapted from: ‘muscle man’ series from Andreas Vesalius, De Humani Corpis Fabrica, 1543, courtesy of the National Library of Medicine; histological micrographs from Baum et al. J Vasc Res 2007;44:202–213. Note: BM thicknesses and molecule sizes are not drawn to scale. B. Mass flows through 3-compartment model. VEGF and sVEGFR1 were secreted from parenchymal and endothelial cell sources respectively. Both were internalized upon binding with abluminal endothelial surface receptors. All soluble species were subjected to lymphatic drainage from interstitial space into the blood, bidirectional permeability through the endothelia, and direct clearance from the blood. C. Molecular Interactions between VEGF121 (yellow), VEGF165 (blue), sVEGFR1 (orange), interstitial matrix binding sites (glycosaminoglycans or “GAG”; purple), and the abluminal endothelial cell surface receptors VEGFR1 (red), VEGFR2 (blue), and NRP1 (green). The sVEGFR1 interactions modeled were: trapping of free VEGF121 (T1a) and VEGF165 (T2); giving NRP1s an indirect way of sequestering VEGF121 to the cell surface (T1b or T3); and displacing VEGF165 from interstitial matrix sites (D1b) through competitive binding (D1a). This model neglected sVEGFR1-heterodimerization with surface VEGFRs, thus ignoring the possible effect of sVEGFR1 in lowering the effective density of functional surface VEGFRs. Hence in this study, any effect that the presence of sVEGFR1 had on VEGF-signaling potential (i.e, the formation of VEGF-VEGFR complexes) resulted from sVEGFR1's influence on the effective concentration of interstitial free VEGF. D. Protein domains of full-length vs. soluble human VEGFR1. sVEGFR1's binding affinities for the VEGF ligand, interstitial matrix sites (e.g., heparan sulfate proteoglycans) and NRP1 were inferred from the identical first 6 immunoglobulin-like domains of the full-length VEGFR1.
Figure 2
Figure 2. Targeting Control VEGF-Secretion Rates (qTotalVEGF) for Basal Profile of Healthy Subject.
A. Steady-state sensitivity of plasma and interstitial concentrations of free VEGF (top and middle rows) and free sVEGFR1 (bottom row) to qTotalVEGF from normal tissue (y-axis) and calf (x-axis. VEGF isoforms were secreted at a ratio of VEGF121∶VEGF165 = 1∶10. Top/middle row: In absence of sVEGFR1 (qsR1 = 0; labelled ‘-sR1’), plasma free VEGF reached the targeted 1.5 pM at the control VEGF-secretion rates of qV,-Ctrl = (qTotalVEGF,Normal, qTotalVEGF,Calf) = (0.264,0.154) molecule/MD/s. The incorporation of sVEGFR1 expression (qsR1 = qsR1,Ctrl; labelled ‘+sR1’) raised plasma VEGF significantly (red arrow) but with negligible effects on interstitial VEGF. To keep plasma free VEGF at the targeted 1.5 pM, the control VEGF-secretion rates were redefined (green arrow) to be qV,+Ctrl = (qTotalVEGF,Normal, qTotalVEGF,Calf) = (0.1925,0.1155) molecule/MD/s. Grey and beige spheres mark the interstitial and plasma VEGF levels reached at qV,-Ctrl and qV,+Ctrl respectively. Bottom row: Despite sVEGFR1's role as a VEGF sink, free sVEGFR1 only changed inversely relative to free VEGF changes in the calf interstitum in the direction of increasing qTotalVEGF,Calf. Orange/black arrows indicate inverse/direct relation between sVEGFR1 concentrations and VEGF-secretion rates. B. Density of VEGF-VEGFR complexes changed in proportion to interstitial free VEGF levels with increasing qTotalVEGF. Bracketed percentages are VEGF-bound fractional occupancies of total VEGFR, averaged (range<0.3%) between normal and calf compartments. In figure: ‘+’ = control; ‘max’ and ‘min’ bound targeted ranges; ‘MD’ = myonuclear domain; ‘V121’ = VEGF121; ‘V165’ = VEGF165; ‘R1’ = VEGFR1; ‘sR1’ = sVEGFR1; ‘R2’ = VEGFR2.
Figure 3
Figure 3. Targeting Control sVEGFR1-Secretion Rates (qsR1) for Basal Profile of Healthy Subject.
A: Steady-state sensitivity of plasma and interstitial concentrations of free VEGF (top row) and free sVEGFR1 (bottom row) to qsR1 from normal tissue (y-axis) and calf (x-axis). Top row: Interstitial free VEGF decreased while plasma free VEGF increased with increasing qsR1. Blue/black arrows indicate inverse/direct relation between VEGF concentrations and sVEGFR1-secretion rates. Bottom Row: The targeted 100 pM of free sVEGFR1 was reached in plasma at the control secretion rates of qsR1,Ctrl = (qsR1,Normal, qsR1,Calf) = (0.0107,0.0210) molecule/EC/s. Beige spheres mark the interstitial and plasma sVEGFR1 levels reached at qsR1,Ctrl. B: Density of VEGF-VEGFR complexes were insensitive to qsR1. Bracketed percentages are VEGF-bound fractional occupancies of total VEGFR, averaged (range<0.4%) between normal and calf compartments. In figure: ‘+’ = control; ‘max’, ‘min’ and ‘mean’ indicate targeted ranges; ‘EC’ = endothelial cell; ‘V121’ = VEGF121; ‘V165’ = VEGF165; ‘R1’ = VEGFR1; ‘sR1’ = sVEGFR1; ‘R2’ = VEGFR2.
Figure 4
Figure 4. Basal Steady-State Flow Profiles of Free VEGF (left), sVEGFR1-VEGF Complexes (middle), Free sVEGFR1 (right).
Solid-colored arrows represent intra-compartmental flows (i.e., secretion, internalization) and inter-compartmental flows (i.e., net vascular permeability, lymph flow, plasma clearance), with their relative magnitudes reflected by arrow widths. Color-graded arrows between columns indicate mass transfer flows between species (i.e., net association of free VEGF and free sVEGFR1 to form sVEGFR1-VEGF complexes, or net dissociation of the complex back into its constituents).
Figure 5
Figure 5. Steady-State Sensitivity to Receptor Density.
A. Sensitivity of plasma and interstitial concentrations of free VEGF, free sR1, and sR1-VEGF complex to NRP1 density (3 surfaces), VEGFR1∶VEGFR2 density ratio (x-axis), and total VEGFR density (y-axis). B–D. Sensitivity of signaling complex distribution to NRP1 density (B), ratio of VEGFR2∶VEGFR1 density ratio (C), and total VEGFR density (D). Bracketed percentages are VEGF-bound fractional occupancies of total VEGFR1 (left) and total VEGFR2 (right), averaged (range <0.9%) between normal and calf compartments. E. Sensitivity of NRP1 distribution to total VEGFR density. ‘+’ = control; ‘max’ and ‘min’ bound targeted ranges; ‘EC’ = endothelial cell; ‘V121’ = VEGF121; ‘V165’ = VEGF165; ‘R1’ = VEGFR1; ‘sR1’ = sVEGFR1; ‘R2’ = VEGFR2.
Figure 6
Figure 6. Steady-State Sensitivity to VEGF-Binding Affinities of Cell Surface Receptors: VEGFR1, VEGFR2 and NRP1.
A. Higher VEGF-VEGFR1 affinity and VEGF-VEGFR2 affinity respectively shifted the signaling profile towards anti- and pro-angiogenic complexes. B. Free VEGF levels lowered with increasing VEGF-binding affinity of either VEGFR1 or VEGFR2; while free sVEGFR1 levels rose and fell with increasing VEGF-VEGFR1 and VEGF-VEGFR2 affinity respectively. C. Availability of unbound NRP1 changed inversely with the amount of VEGFR2-VEGF165-NRP1 formed. Free VEGF and sVEGFR1 levels (D), as well as signaling profiles (E), were largely insensitive to NRP1's direct binding-affinity with VEGF. Bracketed percentages in A and D are VEGF-bound fractional occupancies of total VEGFR, averaged (range <0.3%) between normal and calf compartments. ‘+’/‘Ctrl’ = control; ‘Kd(V,R)’ = dissociation constant between VEGF and VEGFR; ‘Kd(V121/V165,N)’ = dissociation constants between VEGF121/VEGF165 and NRP1; ‘R1’ = VEGFR1; ‘sR1’ = sVEGFR1; ‘R2’ = VEGFR2.
Figure 7
Figure 7. Sensitivity to Density & VEGF-Binding Affinity of Interstitial Matrix Sites for VEGF165 & sVEGFR1.
Steady-state sensitivity of VEGF165 (A) and sVEGFR1 (B) distributions in blood (top), normal tissue (middle) and calf tissue (bottom) compartments to the VEGF165-binding affinity (Kd(M,V)) and densities ([ECM]; [BM]) of interstitial matrix sites. At control: Kd(M,V) = 23.8 nM; [ECM] = 20 µM; [BM] = 0.75 µM. Concentrations of soluble species (e.g., free VEGF165, free sVEGFR1, sVEGFR1-VEGF165) and surface VEGFR occupancies (e.g., VEGF165-VEGFR1, VEGF165-VEGFR2, VEGFR2-VEGF165-NRP1) were completely insensitive; whereas the sizes of matrix-bound reservoirs of VEGF165 and sVEGFR1 (e.g., VEGF165-ECM, sVEGFR1-PBM) were greatly affected. ‘Kd(M,V)’ = dissociation constant between interstitial matrix sites and VEGF165; ‘[ECM]’ and ‘[BM]’ = densities of binding sites for VEGF or sVEGFR1 in extracellular matrix and basement membranes respectively’; ‘Ctrl’ = control; ‘PBM’ = parenchymal BM; ‘EBM’ = endothelial BM; V165 = VEGF165; ‘R1’ = VEGFR1; ‘sR1’ = sVEGFR1; ‘R2’ = VEGFR2.
Figure 8
Figure 8. Steady-State Effects of Permeability Rate (kP) on VEGF and sVEGFR1 Concentrations (A) & Flows (B).
In general, with increasing kP, concentrations changed in the directions that reduced transendothelial gradients: (i) plasma VEGF concentration increased; (ii) plasma sVEGFR1 decreased and interstitial sVEGFR1 increased. Exceptions were observed with localized changes in kP – e.g., increasing only kP,Normal from ‘supine(ctrl)’ to ‘fenestration’ enhanced sVEGFR1 extravasation into the normal compartment in expense of that into the calf, causing non-uniform changes in interstitial sVEGFR1 concentrations (increased locally, decreased distally). ‘Lo’ = low; ‘Dep’ = dependent; ‘+’ = supine (control); ‘Ex’ = exercise; ‘Fen’ = fenestration; ‘H’ = high.
Figure 9
Figure 9. Steady-State and Dynamic Effects of Lymphatic Drainage Rates (kL).
Steady-state effects of kL on VEGF and sVEGFR1 concentrations (A) and flows (B). Of the three transport parameters (kP, kL, kCL), increasing kL over two orders of magnitude about the control value resulted in the greatest fluctuations in steady-state concentrations: most significantly elevating plasma VEGF and sVEGFR1, while lowering interstitial sVEGFR1. Exceptions were noted with localized changes in kL – e.g., with increasing only kL,Normal from ‘CP’ to ‘PE’, the enhanced flushing of sVEGFR1 from the local interstitium into the plasma eventually spilled over through increased sVEGFR1 extravasation into the opposite compartment to elevate interstitial sVEGFR1 concentration there. In addition, a reversal in permeability flow of sVEGFR1-VEGF complex (red box) was noted for kL above control. ‘Lo’ = low; ‘Nite’ = night; ‘+’ = supine awake (control); ‘SE’ = whole-body steady exercise; ‘CP’ = calf-only peak exercise; ‘PE’ = whole-body peak exercise; ‘Hi’ = high. Dynamic Effects of kL on VEGF, sVEGFR1, and sR1-VEGF Concentrations (C). kL-driven fluctuations in VEGF and sVEGFR1 attained within physiological diurnal cycles were less than those attained during steady-state analyses but still were of very wide ranges. “Bed-rest days” (purple columns) consisted of 15 hrs of wakefulness limited to supine or sitting postures, followed by 9 hrs of sleep. “Active days” (yellow columns) consisted of 15-hrs of activity starting off with a peak in kL during early exercise and settling down to a steady running/walking rate, followed by 9 hrs of sleep. Reversed permeability flow of sVEGFR1-VEGF complex (red cross-hatching) was observed in the latter active waking hours. “Calf-limited activity days” (aqua column) are same as “bed-rest days” except that active kL was induced in the calf during the first 15 hrs of wakefulness. Stick-figure illustrations adapted from Olszewski et al. Lymphology 1977, 10(3):178–183.
Figure 10
Figure 10. Steady-state Effects of Plasma Clearance Rate (kCL) on VEGF and sVEGFR1 Concentrations.
Increasing kCL resulted in: (i) drastically lower plasma concentrations of both free VEGF and sVEGFR1, (ii) lower interstitial sVEGFR1 but unchanged interstitial VEGF, and (iii) reduced transendothelial gradient for VEGF but not for sVEGFR1.

References

    1. Yla-Herttuala S, Rissanen TT, Vajanto I, Hartikainen J. Vascular endothelial growth factors: Biology and current status of clinical applications in cardiovascular medicine. J Am Coll Cardiol. 2007;49(10):1015–1026. - PubMed
    1. Carmeliet P, Jain RK. Angiogenesis in cancer and other diseases. Nature. 2000;407(6801):249–257. - PubMed
    1. Mac Gabhann F, Popel AS. Systems biology of vascular endothelial growth factors. Microcirculation. 2008;15(8):715–38. - PMC - PubMed
    1. Gustafsson T, Ameln H, Fischer H, Sundberg CJ, Timmons JA, et al. VEGF-A splice variants and related receptor expression in human skeletal muscle following submaximal exercise. J Appl Physiol. 2005;98(6):2137–2146. - PubMed
    1. Ng YS, Rohan R, Sunday ME, Demello DE, D'Amore PA. Differential expression of VEGF isoforms in mouse during development and in the adult. Dev Dyn. 2001;220(2):112–121. - PubMed

Publication types

MeSH terms

Substances