

Temporal changes in the T1 and T2 relaxation rates (DeltaR1 and DeltaR2) in the rat brain are consistent with the tissue-clearance rates of elemental manganese
- PMID: 19353652
- PMCID: PMC2756245
- DOI: 10.1002/mrm.21962
Temporal changes in the T1 and T2 relaxation rates (DeltaR1 and DeltaR2) in the rat brain are consistent with the tissue-clearance rates of elemental manganese
Abstract
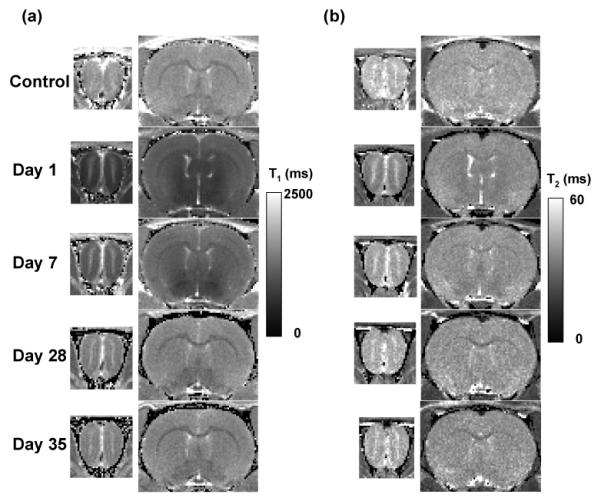
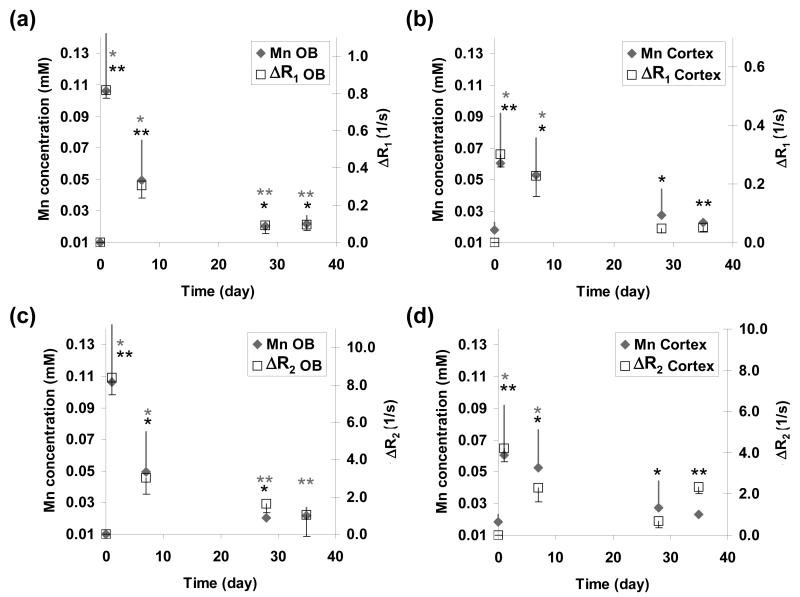
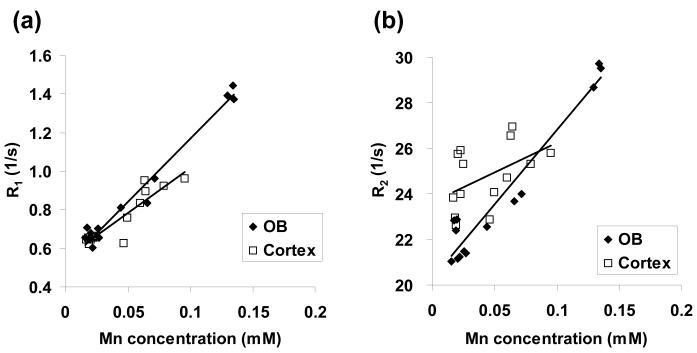
Temporal changes in the T(1) and T(2) relaxation rates (DeltaR(1) and DeltaR(2)) in rat olfactory bulb (OB) and cortex were compared with the absolute manganese (Mn) concentrations from the corresponding excised tissue samples. In vivo T(1) and T(2) relaxation times were measured before, and at 1, 7, 28, and 35 d after intravenous infusion of 176 mg/kg MnCl(2). The values of DeltaR(1), DeltaR(2), and absolute Mn concentration peaked at day 1 and then declined to near control levels after 28 to 35 d. The Mn bioelimination rate from the rat brain was significantly faster than that reported using radioisotope techniques. The R(1) and R(2) relaxation rates were linearly proportional to the underlying tissue Mn concentration and reflect the total absolute amount of Mn present in the tissue. The in vivo Mn r(1) and r(2) tissue relaxivities were comparable to the in vitro values for aqueous Mn(2+). These results demonstrate that loss of manganese-enhanced MRI (MEMRI) contrast after systemic Mn(2+) administration is due to elimination of Mn(2+) from the brain.
Figures
References
-
- Takeda A. Manganese action in brain function. Brain Res Brain Res Rev. 2003;41(1):79–87. - PubMed
-
- Normandin L, Hazell AS. Manganese neurotoxicity: an update of pathophysiologic mechanisms. Metab Brain Dis. 2002;17(4):375–387. - PubMed
-
- Gavin CE, Gunter KK, Gunter TE. Mn2+ sequestration by mitochondria and inhibition of oxidative phosphorylation. Toxicol Appl Pharmacol. 1992;115(1):1–5. - PubMed
-
- Takeda A, Sawashita J, Okada S. Biological half-lives of zinc and manganese in rat brain. Brain Res. 1995;695(1):53–58. - PubMed
-
- Aoki I, Wu YJ, Silva AC, Lynch RM, Koretsky AP. In vivo detection of neuroarchitecture in the rodent brain using manganese-enhanced MRI. Neuroimage. 2004;22(3):1046–1059. - PubMed
Publication types
MeSH terms
Substances
Grants and funding
LinkOut - more resources
Full Text Sources
Miscellaneous
