. 2009 Jul;62(1):141-8.
doi: 10.1002/mrm.21994.

Noninvasive quantification of whole-brain cerebral metabolic rate of oxygen (CMRO2) by MRI

Affiliations

Noninvasive quantification of whole-brain cerebral metabolic rate of oxygen (CMRO2) by MRI

Feng Xu et al. Magn Reson Med. 2009 Jul.

Abstract

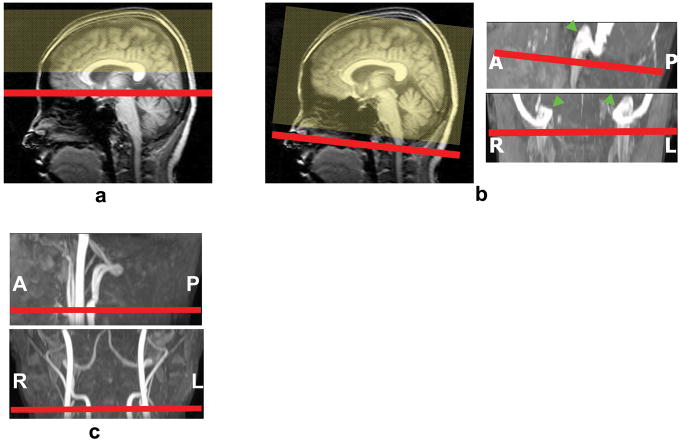
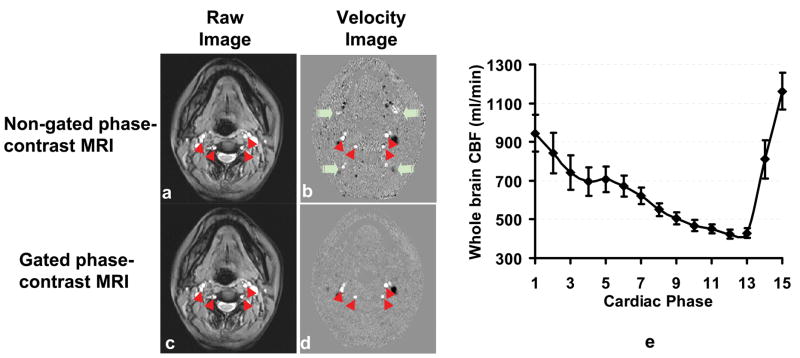
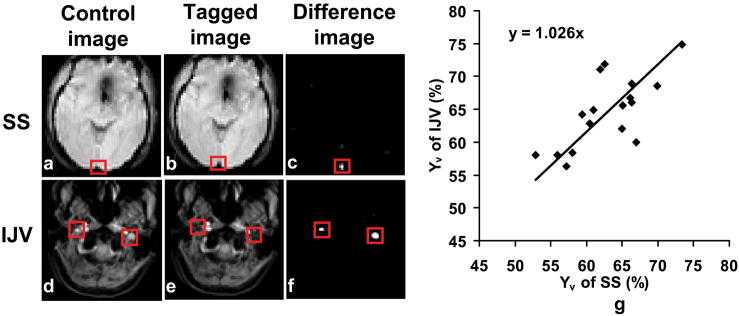
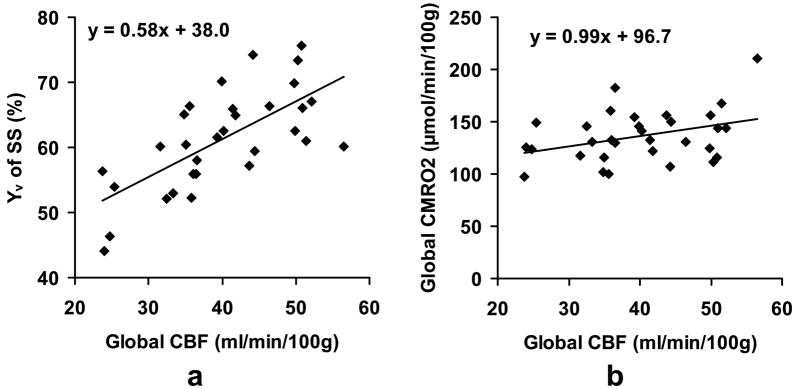
Cerebral metabolic rate of oxygen (CMRO(2)) is an important marker for brain function and brain health. Existing techniques for quantification of CMRO(2) with positron emission tomography (PET) or MRI involve special equipment and/or exogenous agents, and may not be suitable for routine clinical studies. In the present study, a noninvasive method is developed to estimate whole-brain CMRO(2) in humans. This method applies phase-contrast MRI for quantitative blood flow measurement and T(2)-relaxation-under-spin-tagging (TRUST) MRI for venous oxygenation estimation, and uses the Fick principle of arteriovenous difference for the calculation of CMRO(2). Whole-brain averaged CMRO(2) values in young, healthy subjects were 132.1 +/- 20.0 micromol/100 g/min, in good agreement with literature reports using PET. Various acquisition strategies for phase-contrast and TRUST MRI were compared, and it was found that nongated phase-contrast and sagittal sinus (SS) TRUST MRI were able to provide the most efficient and accurate estimation of CMRO(2). In addition, blood flow and venous oxygenation were found to be positively correlated across subjects. Owing to the noninvasive nature of this method, it may be a convenient and useful approach for assessment of brain metabolism in brain disorders as well as under various physiologic conditions.


Figures

Fig. 1
Fig. 1
Slice positions for the scans in the CMRO2 measurements. (a) Venous oxygenation in SS was estimated by imaging the SS in the occipital region (red) while tagging the venous blood upstream to that location (yellow). (b) The planning of the IJV scan was based on a mid-sagittal survey image and a venogram, and the imaging slice was positioned immediately below the jugular bulb (arrows). (c) Phase-contrast MRI was planned on an angiogram and the slice orientation was perpendicular to internal carotid and vertebral arteries.
Fig. 2
Fig. 2
Comparison of gated and non-gated phased-contrast MRI. The raw images (a and c) of these two sequences are similar. However, the velocity map (b) of the non-gated scan shows some ghosting artifacts (green arrows) along the phase-encoding direction (anterior-posterior), due to flow pulsation in large vessels. Red arrowheads indicate the internal carotid and vertebral arteries. (e) Whole brain CBF (summation of internal carotid and vertebral arteries) at different cardiac phases during a heart beat (n=5). The averaged value of all the cardiac phases is comparable the non-gated value (p=0.53). The R-R interval was evenly divided into 15 phases. Error bars indicate the standard errors of mean.
Fig. 3
Fig. 3
Results of TRUST MRI at SS and IJV. The control and tagged images appear similar, while the different images show clear delineation of the tagged vessels. The red boxes illustrate the manually drawn ROI for quantitative analysis. (g) Correlation between estimated venous oxygenation in SS and in IJV (n=17). A significant correlation (cc=0.71, p=0.0015) was found between them. The line is the fitting of the data to y=ax.
Fig. 4
Fig. 4
Correlation between different physiologic parameters across subjects. (a) Scatter plot between global CBF and venous oxygenation (n=31, cc=0.65, p<0.0001). Each dot in the plot represents data from one subject. It can be seen that individual with higher blood flow tends to have higher venous oxygenation, which corresponds to lower oxygen extraction fraction. The line indicates the linear fitting of the data. (b) Scatter plot between global CBF and CMRO2. A weak correlation (cc=0.41, p=0.0222) is observed.
Fig. 5
Fig. 5
TRUST MRI measurement accuracy as a function of scan duration. The measurement accuracy is quantified by the estimation error from the goodness-of-fit analysis.
Fig. 6
Fig. 6
Simulation results of the effect of Hct. Variations in Hct cause biases in the estimated Ya-Yv and Ca. These two effects are opposite in directions. Thus, the bias in the estimated CMRO2 is smaller in amplitude. All values are shown in relative changes, i.e. (estimated value-true value)/true value × 100%.

References

    1. Elia M. Organ and tissue contribution to metabolic rate. In: Kinney JM, Tucker HN, editors. Energy Metabolism: Tissue Determinants and Cellular Corollaries. New York: Raven Press Ltd; 1992. pp. 61–77.
    1. Attwell D, Laughlin SB. An energy budget for signaling in the grey matter of the brain. J Cereb Blood Flow Metab. 2001;21:1133–1145. - PubMed
    1. Fox PT, Raichle ME. Focal physiological uncoupling of cerebral blood flow and oxidative metabolism during somatosensory stimulation in human subjects. Proc Natl Acad Sci U S A. 1986;83:1140–1144. - PMC - PubMed
    1. Leenders KL, Palmer AJ, Quinn N, Clark JC, Firnau G, Garnett ES, Nahmias C, Jones T, Marsden CD. Brain dopamine metabolism in patients with Parkinson’s disease measured with positron emission tomography. J Neurol Neurosurg Psychiatry. 1986;49:853–860. - PMC - PubMed
    1. Buckner RL, Snyder AZ, Shannon BJ, LaRossa G, Sachs R, Fotenos AF, Sheline YI, Klunk WE, Mathis CA, Morris JC, Mintun MA. Molecular, structural, and functional characterization of Alzheimer’s disease: evidence for a relationship between default activity, amyloid, and memory. J Neurosci. 2005;25:7709–7717. - PMC - PubMed

Publication types