. 2009 Jun;61(6):1434-40.
doi: 10.1002/mrm.21953.

Accelerated three-dimensional upper airway MRI using compressed sensing

Affiliations

Accelerated three-dimensional upper airway MRI using compressed sensing

Yoon-Chul Kim et al. Magn Reson Med. 2009 Jun.

Abstract

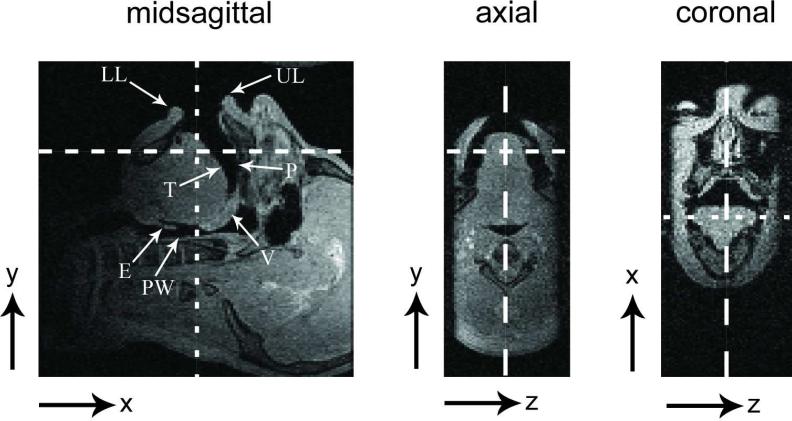
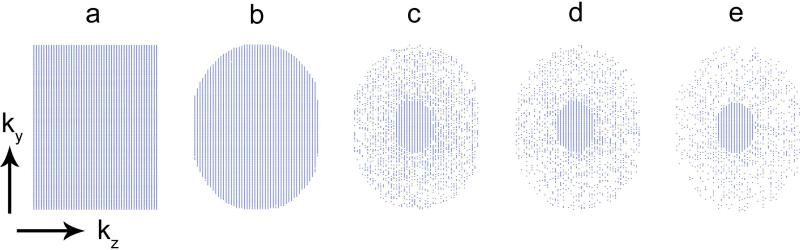
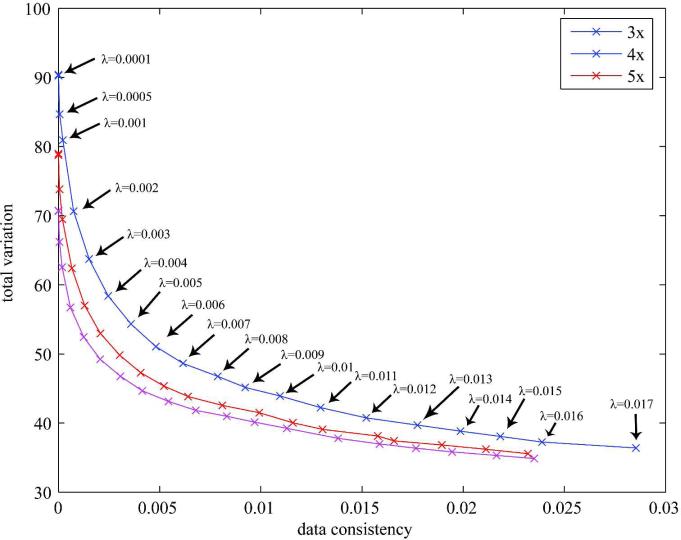
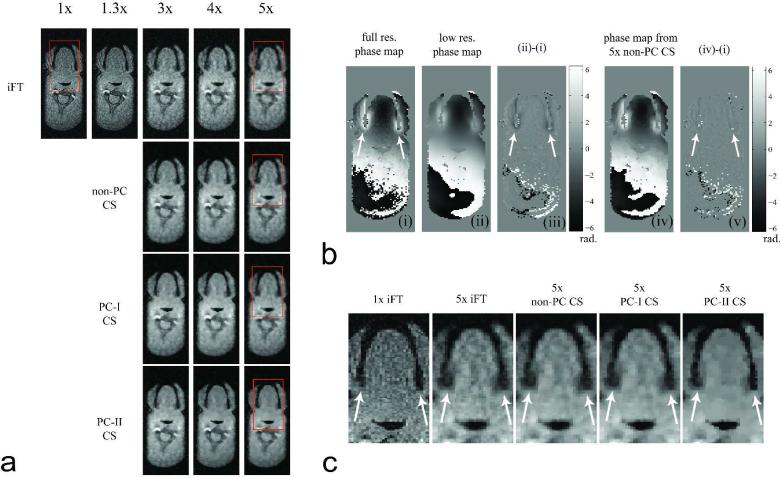
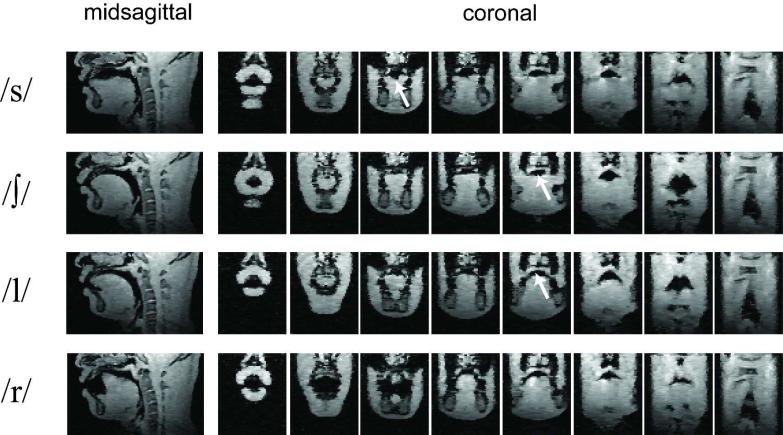
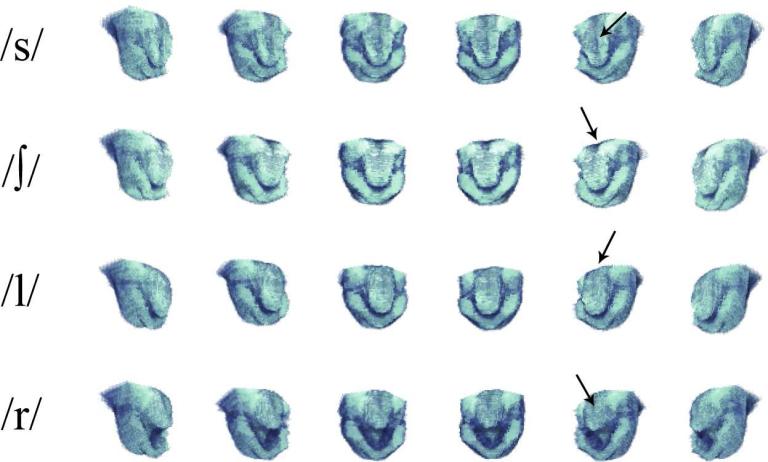
In speech-production research, three-dimensional (3D) MRI of the upper airway has provided insights into vocal tract shaping and data for its modeling. Small movements of articulators can lead to large changes in the produced sound, therefore improving the resolution of these data sets, within the constraints of a sustained speech sound (6-12 s), is an important area for investigation. The purpose of the study is to provide a first application of compressed sensing (CS) to high-resolution 3D upper airway MRI using spatial finite difference as the sparsifying transform, and to experimentally determine the benefit of applying constraints on image phase. Estimates of image phase are incorporated into the CS reconstruction to improve the sparsity of the finite difference of the solution. In a retrospective subsampling experiment with no sound production, 5x and 4x were the highest acceleration factors that produced acceptable image quality when using a phase constraint and when not using a phase constraint, respectively. The prospective use of a 5x undersampled acquisition and phase-constrained CS reconstruction enabled 3D vocal tract MRI during sustained sound production of English consonants /s/, /integral/, /l/, and /r/ with 1.5 x 1.5 x 2.0 mm(3) spatial resolution and 7 s of scan time.


Figures

Figure 1
Figure 1
Illustration of scan plane prescription, which is used for the 3D upper airway imaging. The dashed lines indicate the orthogonal slice orientation of each image. The largest-width, medium-width, and smallest-width dashed lines are for the prescription of the midsagittal, coronal, and axial slices, respectively. An 8 cm sagittal slab excitation is applied to cover the vocal tract volume of interest. The readout direction is along S-I so that the analog low-pass filter suppresses uninteresting regions (e.g., the brain and neck). The features of interest include: [LL] lower lip, [UL] upper lip, [P] palate, [T] tongue surface, [V] velum, [PW] pharyngeal wall, [E] epiglottis.
Figure 2
Figure 2
k-space sampling patterns used in the experimental studies. Relative reduction factors are (a) 1, (b) 1.3, (c) 3, (d) 4, and (e) 5. Note that an ellipse with radii 30% of the overall k-space radii was fully sampled in all cases for the estimation of low-resolution image phase.
Figure 3
Figure 3
L-curve for the selection of regularization parameter λ for CS reconstruction of the 3D upper airway data with reduction factors of 3, 4, and 5. The CS reconstruction was terminated at the 1000th iterate. The plotted points (x) and their corresponding regularization parameter values (λ) are shown for reduction factor 3. Virtually identical patterns were observed for reduction factors 4 and 5. The corners of the L-curve are not sharp, but provide a clear trade-off between total variation (sparsity) and data consistency.
Figure 4
Figure 4
Axial slice reconstructions from retrospective sub-sampling of fully sampled data. (a) Magnitude images reconstructed by use of inverse Fourier transform (iFT), non-phase-constrained compressed sensing (CS), PC-I CS, and PC-II CS reconstructions of 1x, 1.3x, 3x, 4x, 5x sub-sampled data. (b) (i) Full-resolution phase map from fully sampled 1x data. (ii) Low-resolution phase map from fully sampled low-frequency data. (iii) Phase difference between phase maps (i) and (ii). (iv) Phase map from non-PC CS reconstruction of 5x sub-sampled data. (v) Phase difference between phase maps (i) and (iv). (c) Magnified ROIs inside the red rectangle in (a). Notice the sharp depiction of the air tissue boundaries in 5x PC-II CS reconstructed image (see the white arrows in (c)).
Figure 5
Figure 5
Reformatted 2D midsagittal and coronal images after the PC-II CS reconstructions of the 5x undersampled 3DFT dataset. The prospective use of accelerated 3DFT scanning required just 7 seconds of scan time during which one trained subject produced each sustained English consonant /s/, /∫/, /l/, and /r/. This achieved 1.5 × 1.5 × 2.0 mm3 resolution over a 24 × 24 × 10 cm3 FOV. Representative 2D midsagittal images are shown in the leftmost column. Eight representative coronal slices of interest are shown that are ordered from lips to pharyngeal wall. Important articulatory features provided by the 3D vocal tract dataset include: (1) groove of the tongue surface for fricative sound /s/ (see the arrow in the /s/ row) and (2) wider shaping of the vocal tract between the hard palate and the tongue front for /l/ indicating the curving of the tongue sides to allow airflow along the sides (for the comparison, see the arrows in the /∫/ and /l/ rows) although their 2D midsagittal slices exhibit similar shaping patterns.
Figure 6
Figure 6
3D visualization of the tongue and lower jaw after the PC-II CS reconstructions from the dataset prospectively acquired with 5x acceleration. Tongue grooves are seen for /s/ and /∫/, further forward in /s/ than /∫/, but not for /l/ (see the arrows in /s/, /∫/, and /l/). Cupping of the tongue (i.e., cavity behind the tongue front) is seen for /r/ (see the arrow in /r/).

References

    1. Stone M, Faber A, Cordaro M. Cross-sectional tongue movement and tongue-palate movement in [s] and [sh] syllables. Proceedings of the 13th International Congress of Phonetic Sciences, Universite de Provence. 1991:354–357.
    1. Stone M, Faber A, Raphael LJ, Shawker TH. Cross-sectional tongue shapes and linguopalatal contact patterns in [s], [sh], and [l]. J Phonetics. 1992;20(2):253–270.
    1. Narayanan SS, Alwan AA, Haker K. An articulatory study of fricative consonants using magnetic resonance imaging. J Acoust Soc Am. 1995;98(3):1325–1347.
    1. Alwan A, Narayanan S, Haker K. Toward articulatory-acoustic models for liquid consonants based on MRI and EPG data. Part II: The rhotics. J Acoust Soc Am. 1997;101:1078–1089. - PubMed
    1. Narayanan S, Byrd D, Kaun A. Geometry, kinematics, and acoustics of Tamil liquid consonants. J Acoust Soc Am. 1999:1993–2007. - PubMed

Publication types

MeSH terms