. 2009 Apr 7;7(4):e1000063.
doi: 10.1371/journal.pbio.1000063.

Receptive fields in primate retina are coordinated to sample visual space more uniformly

Affiliations

Receptive fields in primate retina are coordinated to sample visual space more uniformly

Jeffrey L Gauthier et al. PLoS Biol. .

Abstract

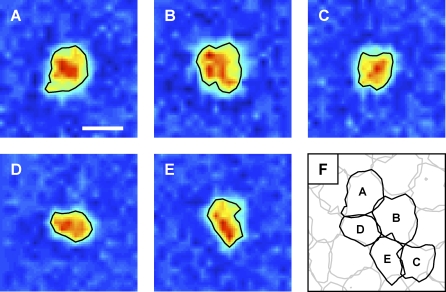
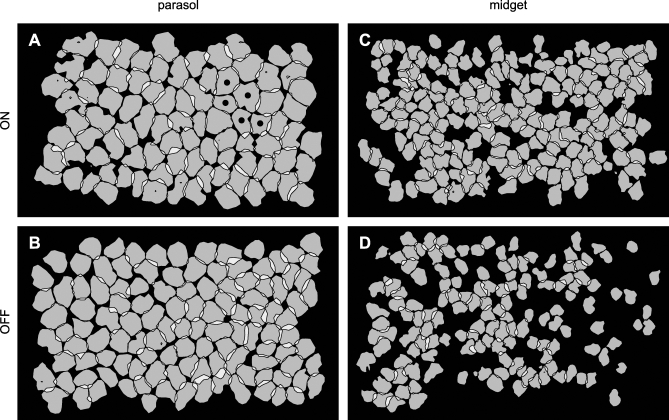
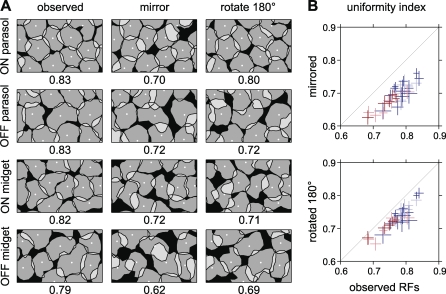
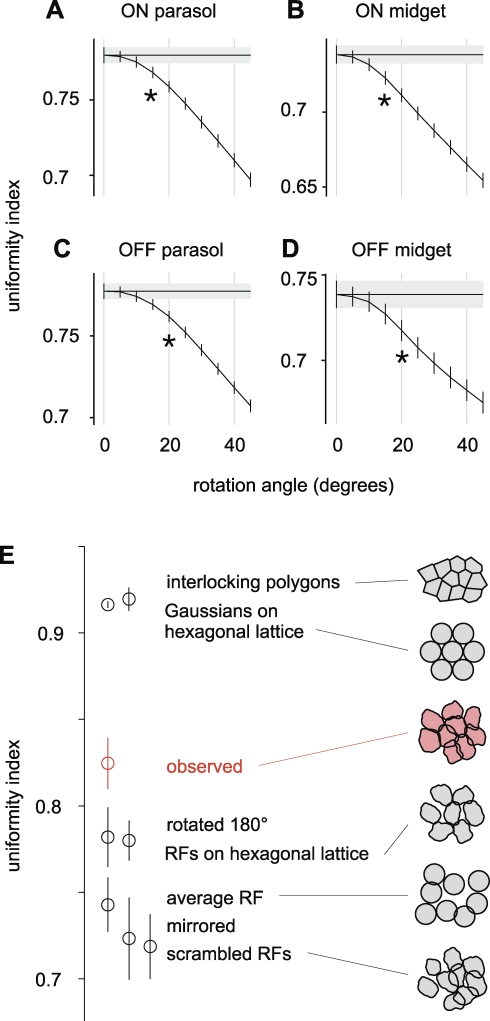
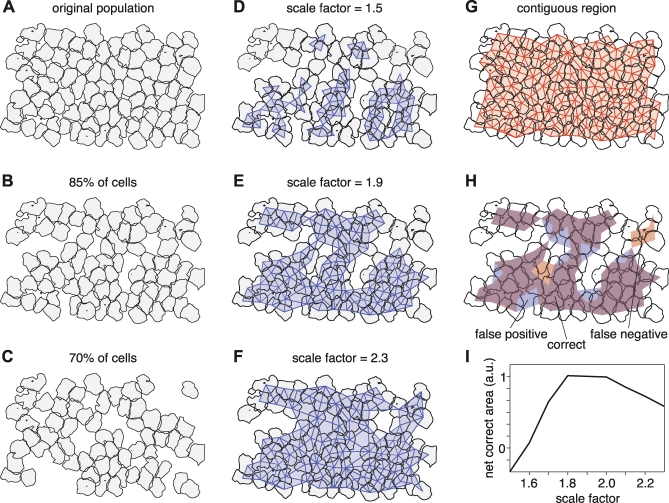
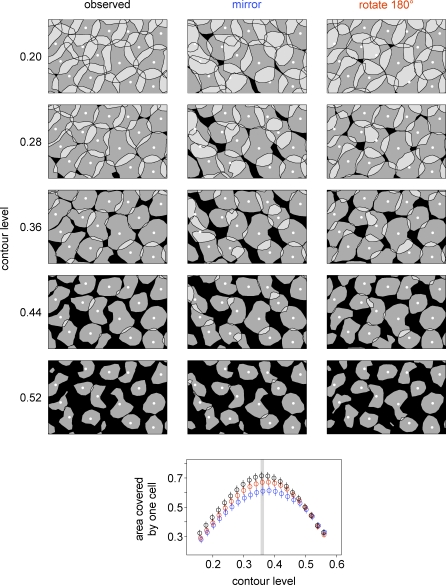
In the visual system, large ensembles of neurons collectively sample visual space with receptive fields (RFs). A puzzling problem is how neural ensembles provide a uniform, high-resolution visual representation in spite of irregularities in the RFs of individual cells. This problem was approached by simultaneously mapping the RFs of hundreds of primate retinal ganglion cells. As observed in previous studies, RFs exhibited irregular shapes that deviated from standard Gaussian models. Surprisingly, these irregularities were coordinated at a fine spatial scale: RFs interlocked with their neighbors, filling in gaps and avoiding large variations in overlap. RF shapes were coordinated with high spatial precision: the observed uniformity was degraded by angular perturbations as small as 15 degrees, and the observed populations sampled visual space with more than 50% of the theoretical ideal uniformity. These results show that the primate retina encodes light with an exquisitely coordinated array of RF shapes, illustrating a higher degree of functional precision in the neural circuitry than previously appreciated.


Conflict of interest statement

Competing interests. The authors have declared that no competing interests exist.

Figures

Figure 1
Figure 1. Irregularly Shaped RFs Were Coordinated, Providing More Uniform Sampling of Visual Space
(A–E) Receptive fields (RFs) of five simultaneously recorded on parasol cells mapped using white noise exhibited an irregular fine structure that deviates from a simple Gaussian model. Warmer colors indicate greater light sensitivity. For visualization (Figures 1 and 2) and analysis (Figures 3 and 4), each RF was low-pass filtered to suppress measurement noise and summarized by a contour line describing its shape at a single contour level (see Materials and Methods). Surrounds were too weak to be seen in individual cells, but averaging over cells revealed a clear surround in all four cell types (unpublished data). The RFs of off parasol and on and off midget cells had similar irregular shapes (see Figure 2). For visualization in this figure only, pixels were subsampled using linear interpolation by a linear factor of 3. Scale bar indicates 180 μm. (F) The contours of the on parasol cells shown in (A–E).
Figure 2
Figure 2. Irregular RF Shapes Were Coordinated in Large Populations of on and off Midget and Parasol Cells
The simultaneously recorded RFs of each cell type formed a regularly spaced mosaic, represented here as a collection of contour lines. The contour level was the same for all cells in each mosaic, and was chosen so that neighboring contours, on average, just touched (see Materials and Methods). The width of each panel represents approximately 2.2 mm on the retina. (A) RFs of 88 simultaneously recorded on parasol cells from 9 mm eccentricity (temporal retina). Cells marked with a dot are those shown in Figure 1. (B) RFs of 117 simultaneously recorded off parasol cells from the same preparation as in (A). (C) RFs of 179 simultaneously recorded on midget cells from 8 mm eccentricity (superior retina). (D) RFs of 141 simultaneously recorded off midget cells from 11.5 mm eccentricity (superior-nasal retina).
Figure 3
Figure 3. RF Coordination Was Perturbed by Mirroring and Rotation
(A) RFs of each cell type are shown at high resolution along with geometric tests of RF coordination. In the observed mosaic (left column), cells appeared to interlock like puzzle pieces. Randomizing the interaction between RF contours by mirroring (center column) or rotating (right column) disrupted visual coverage, demonstrating that fine RF structure is locally coordinated, making visual sampling more uniform (see text). The center point around which RF contours were rotated or mirrored was the center point of an elliptical difference of Gaussians fit. Numbers beneath each panel indicate the UI in this region (see text). The respective horizontal dimensions of the panels for each cell type represent 930, 840, 570, and 330 μm on the retina. (B) Statistical tests demonstrate that RF interlocking was consistent across many preparations. For each population of simultaneously recorded cells of a single type, the UI value is shown for the observed data and RFs that were mirrored or rotated (see text). On parasol data are shown in light blue, off parasol in dark blue, on midget in light red, and off midget in dark red. In every population, the UI decreased when RF contours were mirrored or rotated, demonstrating that fine RF structure is coordinated with neighbors. Each population was composed of 34 to 239 (mean 98) simultaneously recorded cells, for a total of 3,140 cells from 32 populations. Error bars represent the SEM within each population (see Materials and Methods).
Figure 4
Figure 4. Precision and Theoretical Bounds on RF Coordination
(A) Test to identify the minimum perturbation that significantly disrupts the uniformity of coverage. For on parasol preparations, the UI is plotted as a function of the angle by which RFs were rotated around their center points. Data from clockwise and counterclockwise rotations were pooled (see Materials and Methods). An angle as small as 15° significantly reduced the UI (p <0.01); this angle is represented as an asterisk (*) beneath the curve. Horizontal black line and gray rectangle indicate the mean and error bars on the unrotated condition. (B–D) Same analysis as in Figure 4A applied to other cell types. (E) UI values of observed RFs and various simulated RFs from a representative population of on parasol cells. For a meaningful comparison to the data, noise was added to simulated RFs to match the noise in the observed RFs (see Materials and Methods). As a result, even the most regular arrangement (“interlocking polygons”) produced UI values lower than 1. Error bars represent the SEM within each population (see Materials and Methods).
Figure 5
Figure 5. Algorithm for Selecting Regions of Contiguous Cells
(A) A complete collection of simultaneously recorded on parasol cells (also shown in Figure 2A). (B and C) The same population, randomly subsampled to 85% and 70%, respectively. (D–F) Estimates of the region of contiguous cells from the population in (B), as determined using an automated algorithm with scale factors of 1.5, 1.7, and 1.9 (see text). (G) The true region of contiguous cells for the population in (A). (H) Comparison of the true region of contiguous cells for the population (shown in [B]) and the result of the algorithm using a scale factor of 1.9 (shown in [E]). In purple areas, the algorithm performed correctly; in red areas, the algorithm missed contiguous cells; and in blue areas, the algorithm identified noncontiguous cells as contiguous. (I) Quantification of the algorithm's performance for a range of scale factors. The abscissa shows the scale factor, the ordinate shows the area of correctly identified contiguous cells minus the area of false negatives and false positives (see text). The area is in arbitrary units (a.u.).
Figure 6
Figure 6. Analysis of RF Coordination Was Insensitive to the Contour Level
Top panels show a population of on parasol cells (12-mm eccentricity) in which each RF is drawn at the contour level indicated by the left-side labels. The first column shows observed RFs, and the second and third columns show RFs mirrored or rotated 180°, respectively. The width of each panel represents 660 μm on the retina. The bottom scatter plot shows how the area covered by exactly one cell varied with different contour levels, for both the observed and perturbed RFs. The contour level that maximized the area covered by one cell, 0.36, is indicated with a gray line. At each contour level, the area covered by one cell is plotted for observed RFs (black), mirrored RFs (blue), and rotated RFs (red). Error bars represent the SEM within each population (see Materials and Methods). Perturbing RFs reduced the area covered by a single cell over a wide range of contour levels surrounding the optimum.

References

    1. Callaway EM. Structure and function of parallel pathways in the primate early visual system. J Physiol. 2005;566(Pt 1):13–19. - PMC - PubMed
    1. Thibos LN, Levick WR. Bimodal receptive fields of cat retinal ganglion cells. Vision Res. 1983;23:1561–1572. - PubMed
    1. Brown SP, He S, Masland RH. Receptive field microstructure and dendritic geometry of retinal ganglion cells. Neuron. 2000;27:371–383. - PubMed
    1. Yang G, Masland RH. Receptive fields and dendritic structure of directionally selective retinal ganglion cells. J Neurosci. 1994;14:5267–5280. - PMC - PubMed
    1. Passaglia CL, Troy JB, Ruttiger L, Lee BB. Orientation sensitivity of ganglion cells in primate retina. Vision Res. 2002;42:683–694. - PMC - PubMed

Publication types