. 2008 Nov;1(6):705-17.
doi: 10.1016/j.jcmg.2008.06.008. Epub 2008 Nov 18.

Characterization and quantification of vortex flow in the human left ventricle by contrast echocardiography using vector particle image velocimetry

Affiliations

Characterization and quantification of vortex flow in the human left ventricle by contrast echocardiography using vector particle image velocimetry

Geu-Ru Hong et al. JACC Cardiovasc Imaging. 2008 Nov.

Abstract

Objectives: The aims of this study were to: 1) assess the feasibility of left ventricular (LV) vortex flow analysis using contrast echocardiography (CE); and 2) characterize and quantify LV vortex flow in normal subjects and patients with LV systolic dysfunction.

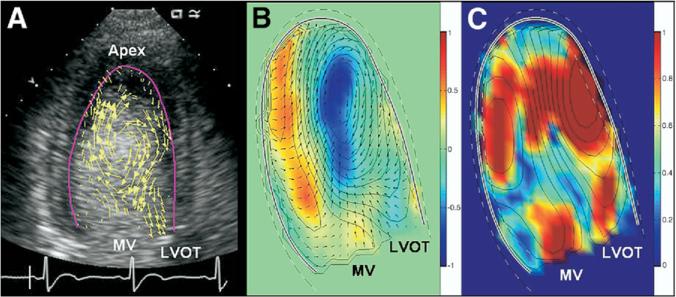
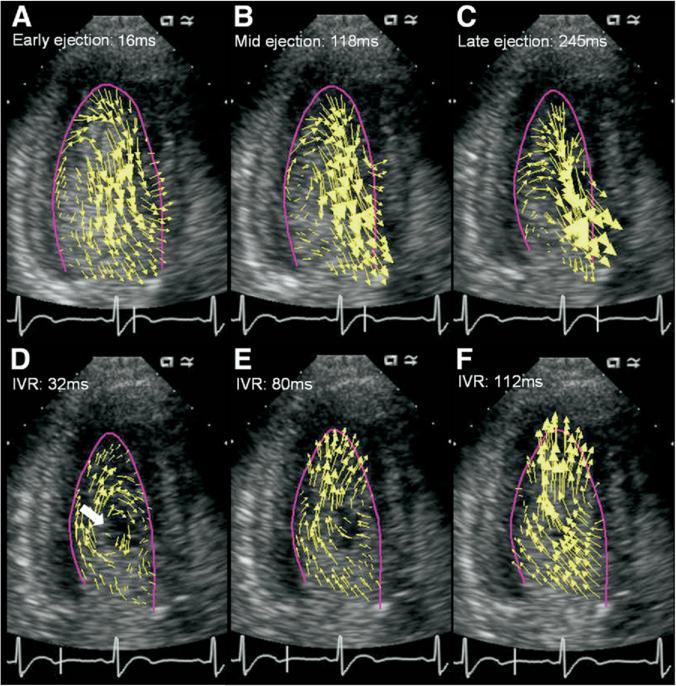
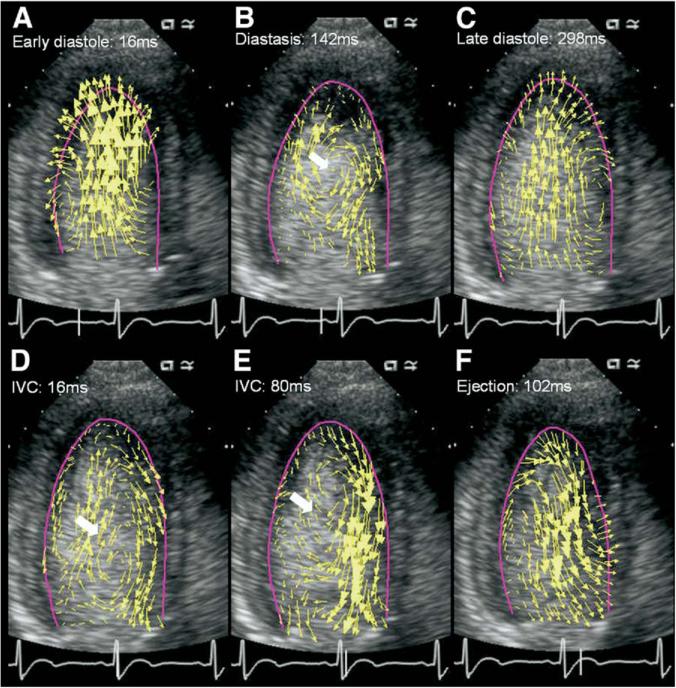
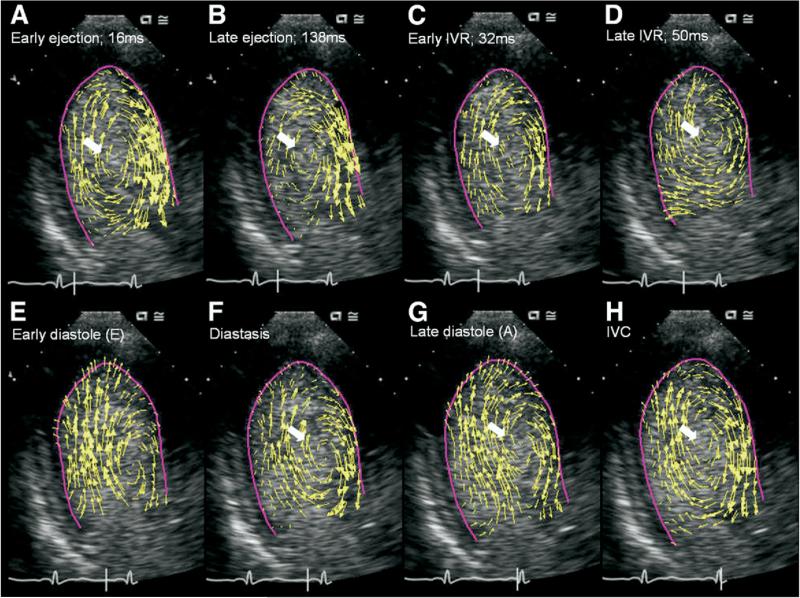
Background: Vortices that form during LV filling have specific geometry and anatomical locations that are critical determinants of directed blood flow during ejection. Therefore, it is clinically relevant to assess the vortex flow patterns to better understand the LV function.

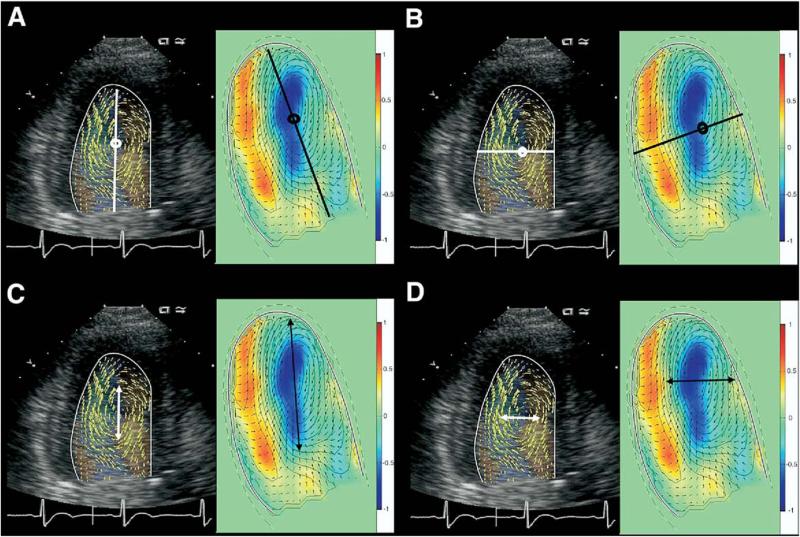
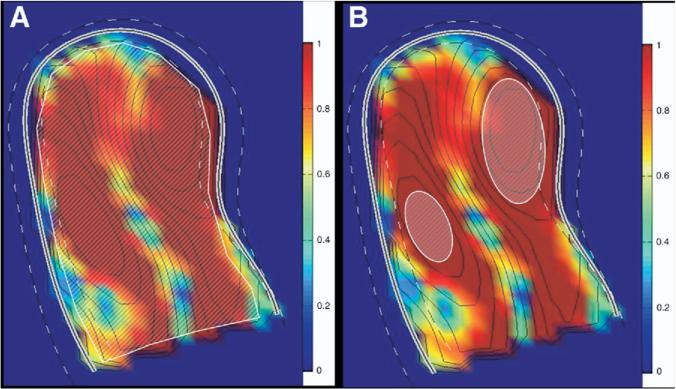
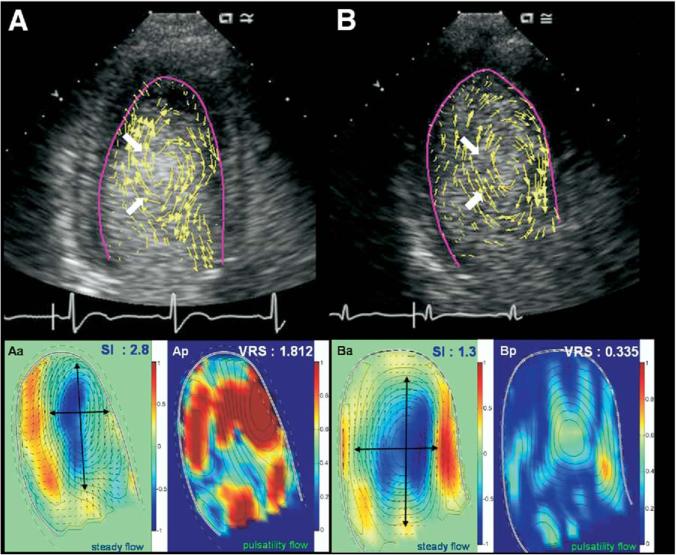
Methods: Twenty-five patients (10 normal and 15 patients with abnormal LV systolic function) underwent CE with intravenous contrast agent, Definity (Bristol-Myers Squibb Medical Imaging, Inc., North Billerica, Massachusetts). The velocity vector and vorticity were estimated by particle image velocimetry. Average vortex parameters including vortex depth, transverse position, length, width, and sphericity index were measured. Vortex pulsatility parameters including relative strength, vortex relative strength, and vortex pulsation correlation were also estimated.

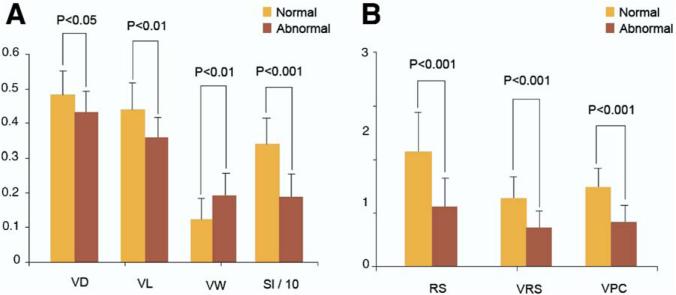
Results: Vortex depth and vortex length were significantly lower in the abnormal LV function group (0.443 +/- 0.04 vs. 0.482 +/- 0.06, p < 0.05; 0.366 +/- 0.06 vs. 0.467 +/- 0.05, p < 0.01, respectively). Vortex width was greater (0.209 +/- 0.05 vs. 0.128 +/- 0.06, p < 0.01) and sphericity index was lower (1.86 +/- 0.5 vs. 3.66 +/- 0.6, p < 0.001) in the abnormal LV function group. Relative strength (1.13 +/- 0.4 vs. 2.10 +/- 0.8, p < 0.001), vortex relative strength (0.57 +/- 0.2 vs. 1.19 +/- 0.5, p < 0.001), and vortex pulsation correlation (0.63 +/- 0.2 vs. 1.31 +/- 0.5, p < 0.001) were significantly lower in the abnormal LV function group.

Conclusions: It was feasible to quantify LV vorticity arrangement by CE using particle image velocimetry in normal subjects and those with LV systolic dysfunction, and the vorticity imaging by CE may serve as a novel approach to depict vortex, the principal quantity to assess the flow structure.


Figures

Figure 1
Figure 1. Flow Data by Digital Particle Image Velocimetry From the Apical Long-Axis View
The Echo freeze frames represent the divergence-free velocity vector on the scan-plane, superimposed to the reconstructed Doppler representation (A). Parametric representations of steady streaming field with superimposed velocity vectors (arrows) and the steady streaming in-plane streamlines along the divergence-free velocity field (B). The pulsatile strength field with superimposed pulsatile in-plane streamlines (C). LVOT = left ventricular outflow tract; MV = mitral valve. See Online Video 1.
Figure 2
Figure 2. Description of How to Measure Quantitative Average Vortex Parameters That Represent Vortex Location and Shape
Vortex depth represents vertical position of center of vortex relative to left ventricular long axis (A, white line), and vortex transverse position represents transverse position relative to posteroseptal axis (B, white line). Vortex length was measured by longitudinal length of vortex relative to left ventricular length (C, white arrow), and vortex width was measured by horizontal length of vortex relative to left ventricular length (D, white arrow). A vortex sphericity index was calculated by vortex length and vortex width.
Figure 3
Figure 3. Description of Quantitative Vortex Pulsatility Parameters
The relative strength represents strength of the pulsatile component of vorticity with respect to the average vorticity in the whole left ventricle (A, white circled area). The vortex relative strength represents the strength of the pulsatile vorticity of vortex (B, white circled area).
Figure 4
Figure 4. Time Sequence Analysis of LV Flow During Ejection and IVR Period in Normal Subjects
During ejection (A to C), the direction of the contrast-vector flow was from left ventricular (LV) apex to LV outflow tract. After the aortic valve closure, in the early isovolumic relaxation (IVR) period, the direction of flow reversed from LV base to apex. During mid-late IVR period (E and F), the nonvertical columnar flow was seen directed from base to apex (early ejection: 16 ms after aortic valve opening [A]; mid-ejection: 118 ms after aortic valve opening [B]; late ejection: 245 ms after aortic valve opening [C]; IVR: 32 ms, 80 ms, and 112 ms after aortic valve closure [D to F]). See Online Video 2.
Figure 5
Figure 5. Time Sequence Analysis of LV Flow During Diastole and IVC Period in Normal Subjects
In the early diastolic period (A), an irrotational flow associated with early left ventricular (LV) filling dominated the vector representation of flow. In diastasis, a relatively apically located vortex was seen (B, arrow). This was followed by a late filling phase that was characterized by an irrotational flow obscuring the vortex (C). In the early isovolumic contraction (IVC) period, the vortex was relocated in the proximity of the anterior mitral leaflet in the LVOT region (D, arrow). During the late IVC period, the vortex persisted in the left ventricular outflow tract region and directed flow towards aortic valve (E). With the aortic valve opening and ejection (F), the vortex dissipated with continued flow from apex to left ventricular outflow tract. Early diastole: 16 ms after mitral valve opening (A); diastasis: 142 ms after mitral valve opening (B); late diastole: 298 ms after mitral valve opening (C); IVC-1: 16 ms after mitral valve closure (D); IVC-2: 80 ms after mitral valve closure (E); ejection: 102 ms after mitral valve opening (F). See Online Videos 3 and 4.
Figure 6
Figure 6. Time Sequence Analysis of LV Flow During 1 Cardiac Cycle in Abnormal LV Systolic Function Group
The vortex was located at the center of the LV throughout diastole and systole and did not redirect flow in a coherent, sequential fashion as in normal subjects. Early ejection: 16 ms after aortic valve opening (A); late ejection: 138 ms after aortic valve opening (B); IVR-1: 32 ms after aortic valve closure (C); IVR-2: 50 ms after aortic valve closure (D); early diastole: 32 ms after mitral valve opening (E); diastasis: 124 ms after mitral valve opening (F); late diastole: 245 ms after mitral valve opening (G); isovolumic contraction period (IVC): 64 ms after mitral valve closure (H). Abbreviations as in Figure 4. See Online Video 5.
Figure 7
Figure 7. Quantitative Vortex Flow Parameters in Normal Subjects and LV Systolic Dysfunction Group
The Echo freeze frames (upper panel), and parametric representation of steady streaming field and the pulsatile strength field (lower panel) in normal (A) and left ventricular (LV) systolic dysfunction groups (B). The vortex in normal subjects showed an elliptical shape (A, Aa, white arrow, sphericity index [SI]: 2.8) and strong pulsatility (Ap, red-colored area, vortex relative strength [VRS]: 1.182), whereas spherical (B, Ba, white arrow, SI: 1.3) and weak pulsatility (Bp, blue-colored area, VRS: 0.335) vortex was observed in patients with systolic heart failure.
Figure 8
Figure 8. Quantitative Flow Vortex Parameters
Comparison of morphological (A) and physiological (B) vortex parameters between normal and abnormal LV systolic function group. RS = relative strength; VD = vortex depth; VL = vortex length; VPC = vortex pulsation correlation; VW = vortex width; other abbreviations as in Figure 7.

References

    1. Wu JZ, Ma HY, Zhou MD. Vorticity and Vortex Dynamics. Springer-Verlag; Berlin-Heidelberg, Germany: 2006.
    1. Kim WY, Walker PG, Pedersen EM, et al. Left ventricular blood flow patterns in normal subjects: a quantitative analysis by three-dimensional mag netic resonance velocity mapping. J Am Coll Cardiol. 1995;26:224–38. - PubMed
    1. Pedrizzetti G, Domenichini F. Nature optimizes the swirling flow in the human left ventricle. Phys Rev Lett. 2005;95:108101. - PubMed
    1. Mohiaddin RH, Yang GZ, Kilner PJ. Visualization of flow by vector analysis of multidirectional cine MR velocity mapping. J Comput Assist Tomogr. 1994;18:383–92. - PubMed
    1. Cenedese A, Del Prete Z, Miozzi M, Querzoli G. A laboratory investigation of the flow in the left ventricle of the human heart with prosthetic, tilting-disk valves. Exp Fluid. 2005;39:322–35.

Publication types

MeSH terms