

Transmural myocardial mechanics during isovolumic contraction
- PMID: 19356557
- PMCID: PMC2821599
- DOI: 10.1016/j.jcmg.2008.11.009
Transmural myocardial mechanics during isovolumic contraction
Abstract
Objectives: We sought to resolve the 3-dimensional transmural heterogeneity in myocardial mechanics observed during the isovolumic contraction (IC) phase.
Background: Although myocardial deformation during IC is expected to be little, recent tissue Doppler imaging studies suggest dynamic myocardial motions during this phase with biphasic longitudinal tissue velocities in left ventricular (LV) long-axis views. A unifying understanding of myocardial mechanics that would account for these dynamic aspects of IC is lacking.
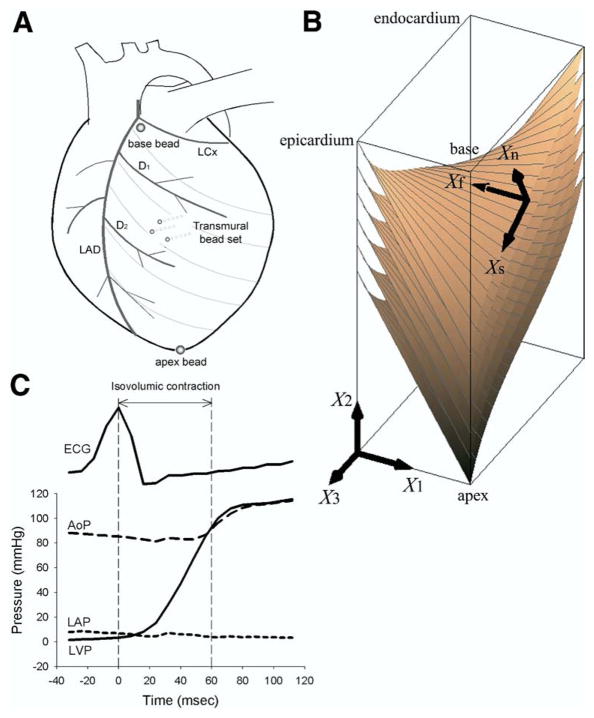
Methods: We determined the time course of 3-dimensional finite strains in the anterior LV of 14 adult mongrel dogs in vivo during IC and ejection with biplane cineradiography of implanted transmural markers. Transmural fiber orientations were histologically measured in the heart tissue postmortem. The strain time course was determined in the subepicardial, midwall, and subendocardial layers referenced to the end-diastolic configuration.
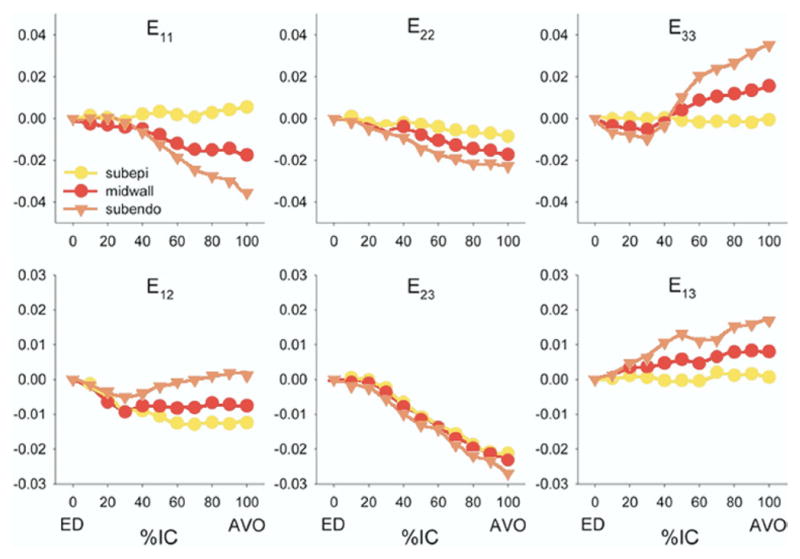
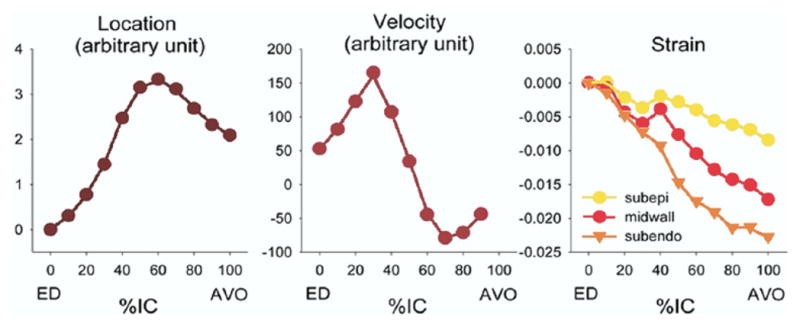
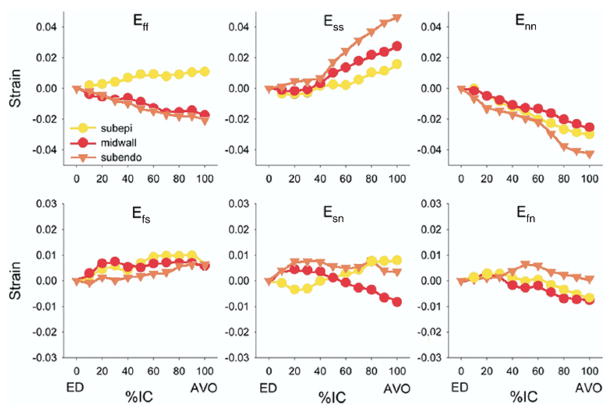
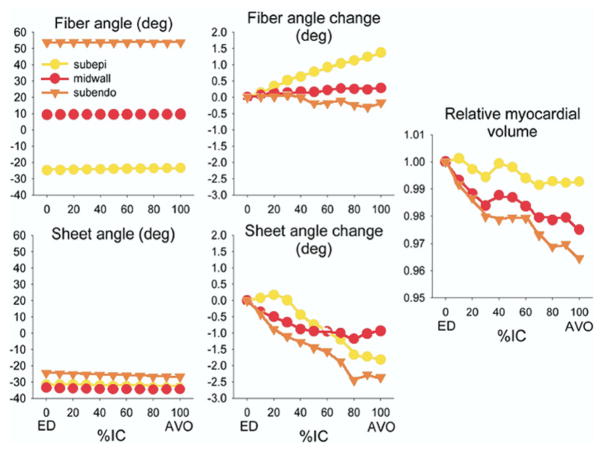
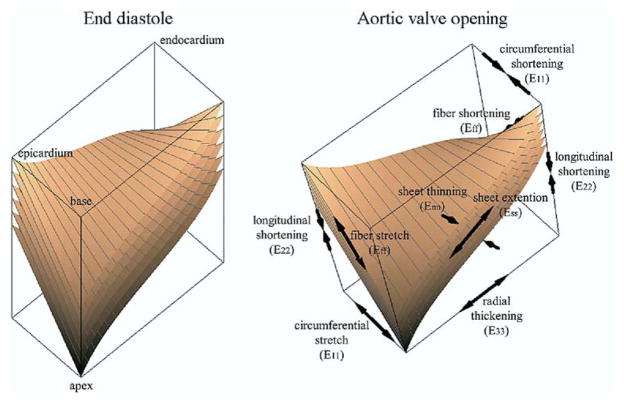
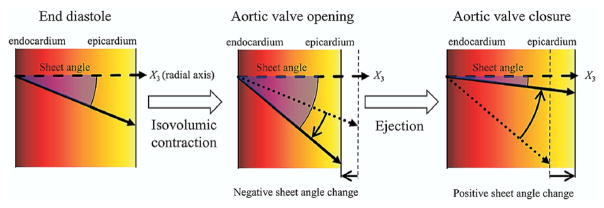
Results: During IC, there was circumferential stretch in the subepicardial layer, whereas circumferential shortening was observed in the midwall and the subendocardial layer. There was significant longitudinal shortening and wall thickening across the wall. Although longitudinal tissue velocity showed a biphasic profile; tissue deformation in the longitudinal as well as other directions was almost linear during IC. Subendocardial fibers shortened, whereas subepicardial fibers lengthened. During ejection, all strain components showed a significant change over time that was greater in magnitude than that of IC. Significant transmural gradient was observed in all normal strains.
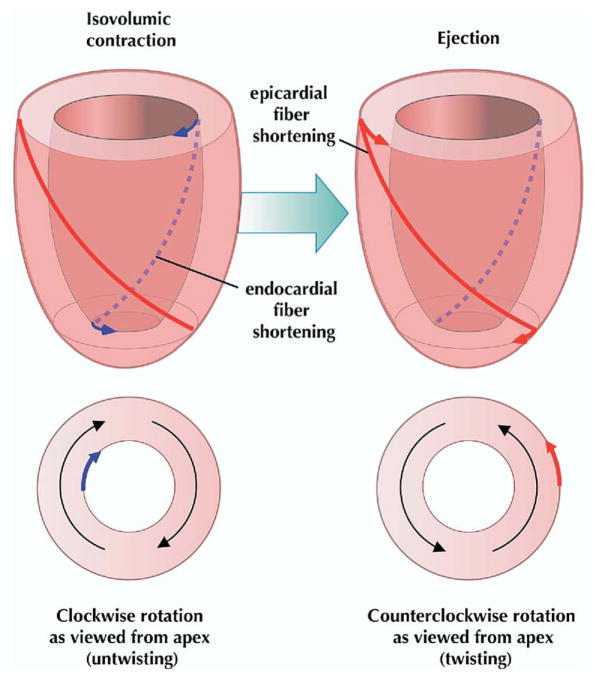
Conclusions: IC is a dynamic phase characterized by deformation in circumferential, longitudinal, and radial directions. Tissue mechanics during IC, including fiber shortening, appear uninterrupted by rapid longitudinal motion created by mitral valve closure. This study is the first to report layer-dependent deformation of circumferential strain, which results from layer-dependent deformation of myofibers during IC. Complex myofiber mechanics provide the mechanism of brief clockwise LV rotation (untwisting) and significant wall thickening during IC within the isovolumic constraint.
Figures
Comment in
-
Exploring left ventricular isovolumic shortening and stretch mechanics: "The heart has its reasons...".JACC Cardiovasc Imaging. 2009 Feb;2(2):212-5. doi: 10.1016/j.jcmg.2008.12.005. JACC Cardiovasc Imaging. 2009. PMID: 19356558 No abstract available.
Similar articles
-
Biphasic tissue Doppler waveforms during isovolumic phases are associated with asynchronous deformation of subendocardial and subepicardial layers.J Appl Physiol (1985). 2005 Sep;99(3):1104-11. doi: 10.1152/japplphysiol.00191.2005. Epub 2005 May 19. J Appl Physiol (1985). 2005. PMID: 15905326
-
Exploring left ventricular isovolumic shortening and stretch mechanics: "The heart has its reasons...".JACC Cardiovasc Imaging. 2009 Feb;2(2):212-5. doi: 10.1016/j.jcmg.2008.12.005. JACC Cardiovasc Imaging. 2009. PMID: 19356558 No abstract available.
-
Alterations in transmural strains adjacent to ischemic myocardium during acute midcircumflex occlusion.J Thorac Cardiovasc Surg. 2005 Apr;129(4):791-803. doi: 10.1016/j.jtcvs.2004.11.011. J Thorac Cardiovasc Surg. 2005. PMID: 15821645
-
[Transmural heterogeneity of the left ventricular wall: subendocardial layer and subepicardial layer].J Cardiol. 2000 Mar;35(3):205-18. J Cardiol. 2000. PMID: 10808428 Review. Japanese.
-
Electromechanical activation sequence in normal heart.Heart Fail Clin. 2008 Jul;4(3):303-14. doi: 10.1016/j.hfc.2008.02.006. Heart Fail Clin. 2008. PMID: 18598982 Review.
Cited by
-
Mechanical aberrations in hypetrophic cardiomyopathy: emerging concepts.Front Physiol. 2015 Aug 19;6:232. doi: 10.3389/fphys.2015.00232. eCollection 2015. Front Physiol. 2015. PMID: 26347658 Free PMC article.
-
Assessment of contractility in intact ventricular cardiomyocytes using the dimensionless 'Frank-Starling Gain' index.Pflugers Arch. 2011 Jul;462(1):39-48. doi: 10.1007/s00424-011-0964-z. Epub 2011 Apr 15. Pflugers Arch. 2011. PMID: 21494804 Free PMC article. Review.
-
Cardiac Systolic Mechanics in Heart Failure with Preserved Ejection Fraction: New Insights and Controversies.Acta Cardiol Sin. 2013 Nov;29(6):515-23. Acta Cardiol Sin. 2013. PMID: 27122752 Free PMC article. Review.
-
Hemodynamic improvement in cardiac resynchronization does not require improvement in left ventricular rotation mechanics: three-dimensional tagged MRI analysis.Circ Cardiovasc Imaging. 2010 Jul;3(4):456-63. doi: 10.1161/CIRCIMAGING.109.906305. Epub 2010 May 17. Circ Cardiovasc Imaging. 2010. PMID: 20478988 Free PMC article.
-
The cardiac muscle duplex as a method to study myocardial heterogeneity.Prog Biophys Mol Biol. 2014 Aug;115(2-3):115-28. doi: 10.1016/j.pbiomolbio.2014.07.010. Epub 2014 Aug 5. Prog Biophys Mol Biol. 2014. PMID: 25106702 Free PMC article. Review.
References
-
- Wiggers CJ. Studies on the consecutive phases of the cardiac cycle. 1. The duration of the consecutive phases of the cardiac cycle and the criteria for their precise determination. Am J Physiol. 1921;56:415–38.
-
- Veyrat C, Larrazet F, Pellerin D. Renewed interest in preejectional isovolumic phase: new applications of tissue Doppler indexes: implications to ventricular dyssynchrony. Am J Cardiol. 2005;96:1022–30. - PubMed
-
- Pellerin D, Cohen L, Larrazet F, Pajany F, Witchitz S, Veyrat C. Preejectional left ventricular wall motion in normal subjects using Doppler tissue imaging and correlation with ejection fraction. Am J Cardiol. 1997;80:601–7. - PubMed
-
- Sengupta PP, Khandheria BK, Korinek J, et al. Left ventricular isovolumic flow sequence during sinus and paced rhythms: new insights from use of high-resolution Doppler and ultrasonic digital particle imaging velocimetry. J Am Coll Cardiol. 2007;49:899–908. - PubMed
-
- Edvardsen T, Urheim S, Skulstad H, Steine K, Ihlen H, Smiseth OA. Quantification of left ventricular systolic function by tissue Doppler echocardiography: added value of measuring pre- and postejection velocities in ischemic myocardium. Circulation. 2002;105:2071–7. - PubMed
Publication types
MeSH terms
Grants and funding
LinkOut - more resources
Full Text Sources
