. 2009 Mar 27;387(2):376-89.
doi: 10.1016/j.jmb.2009.01.058. Epub 2009 Feb 3.

Characterization of the in vitro HIV-1 capsid assembly pathway

Affiliations

Characterization of the in vitro HIV-1 capsid assembly pathway

Eric Barklis et al. J Mol Biol. .

Abstract

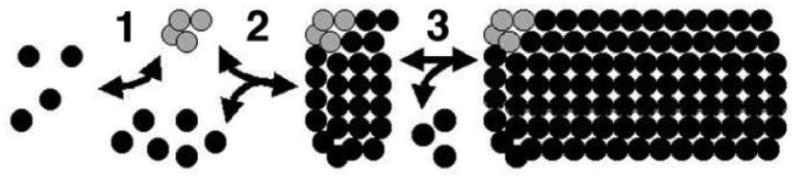
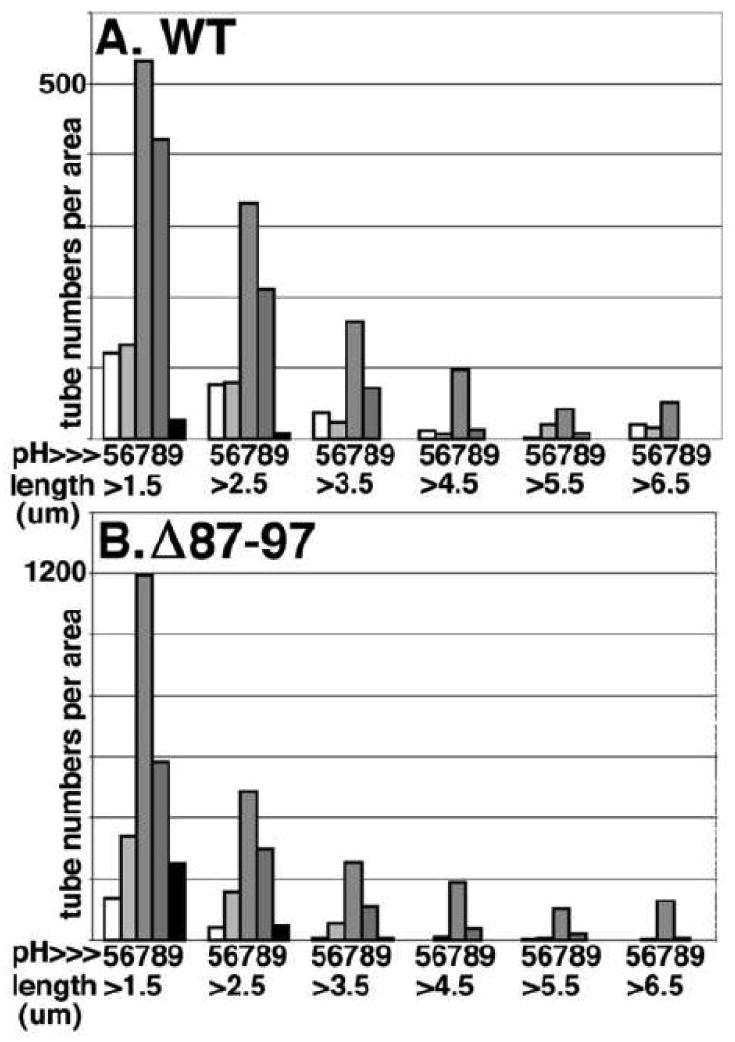
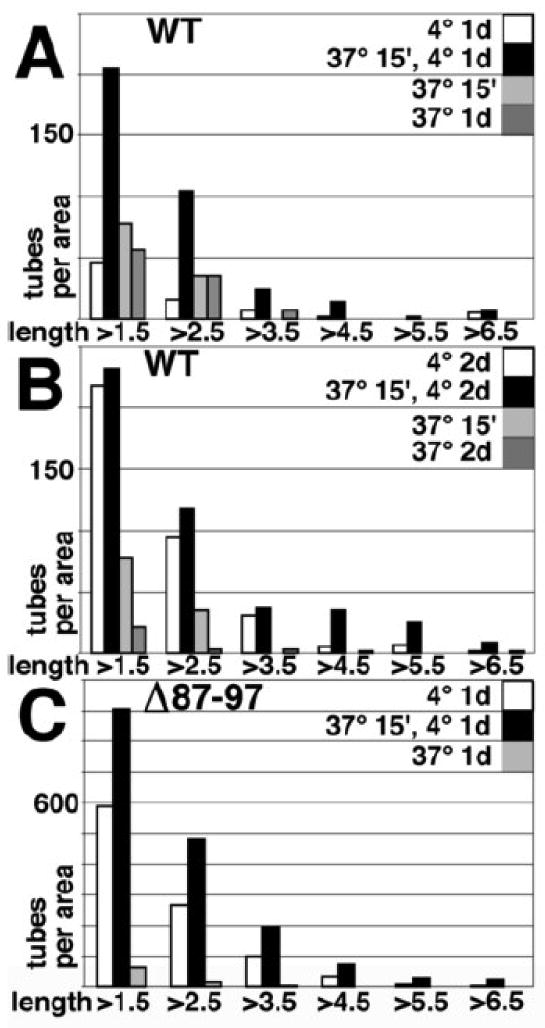
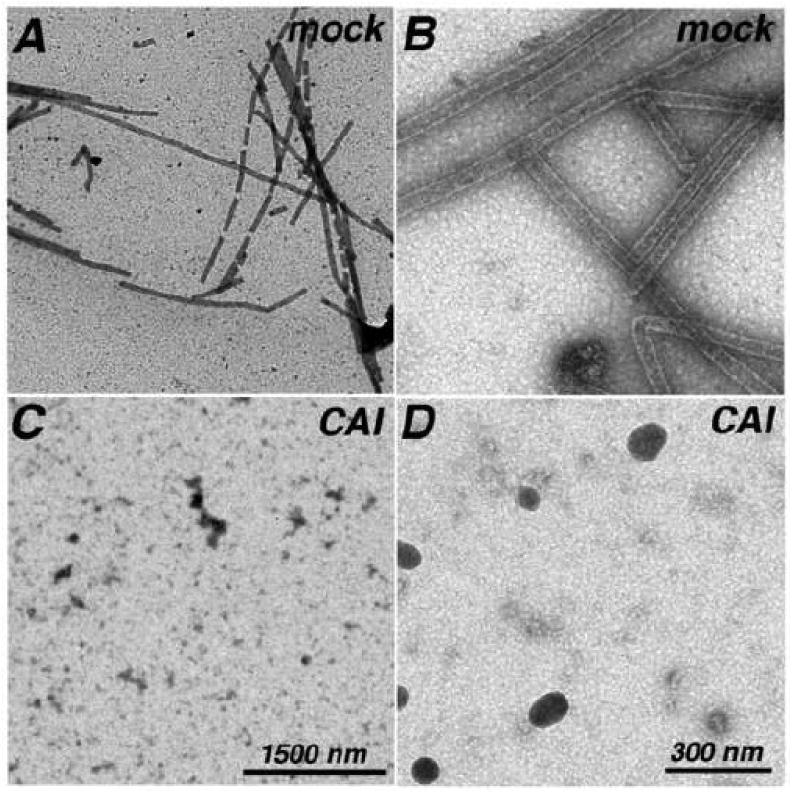
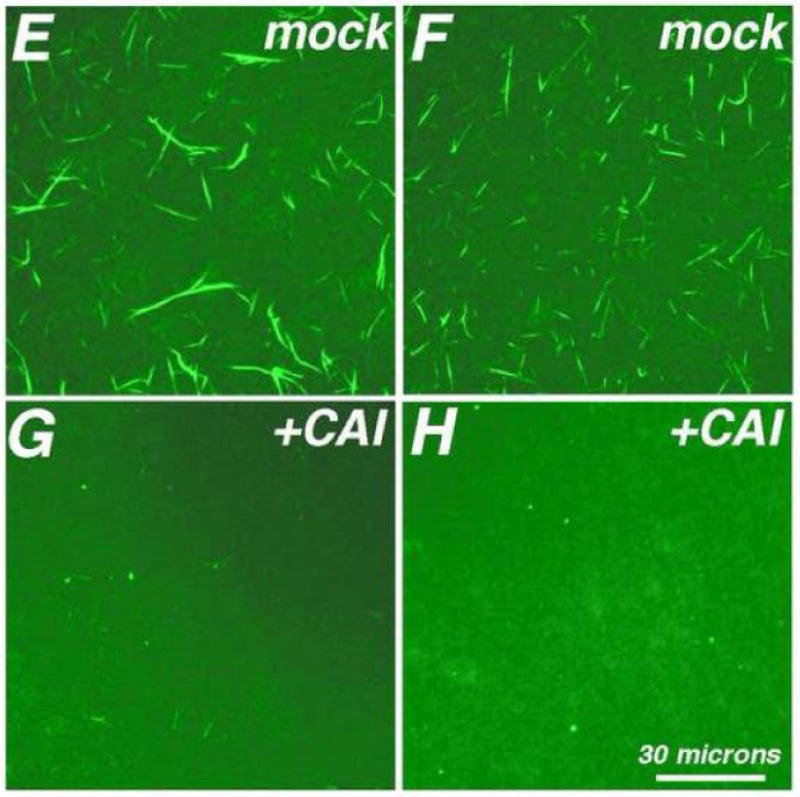
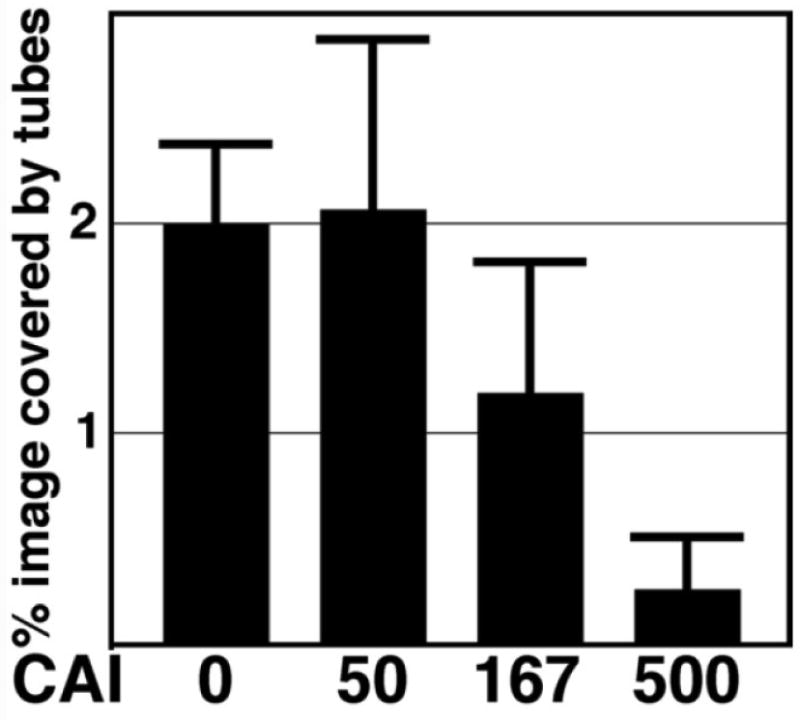
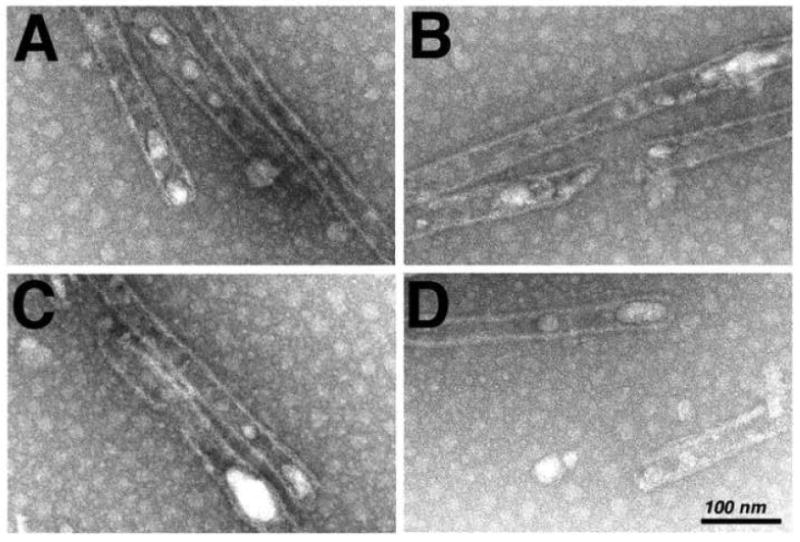
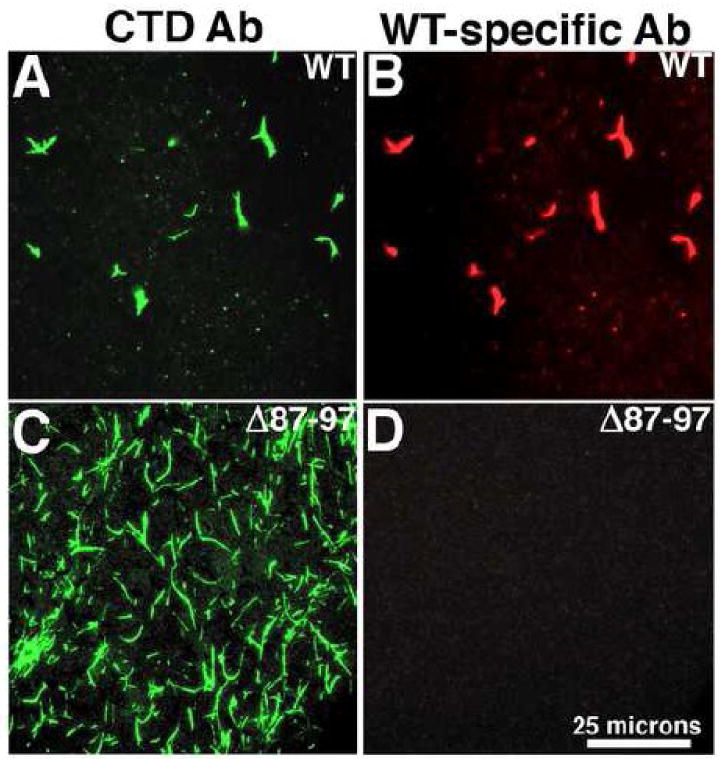
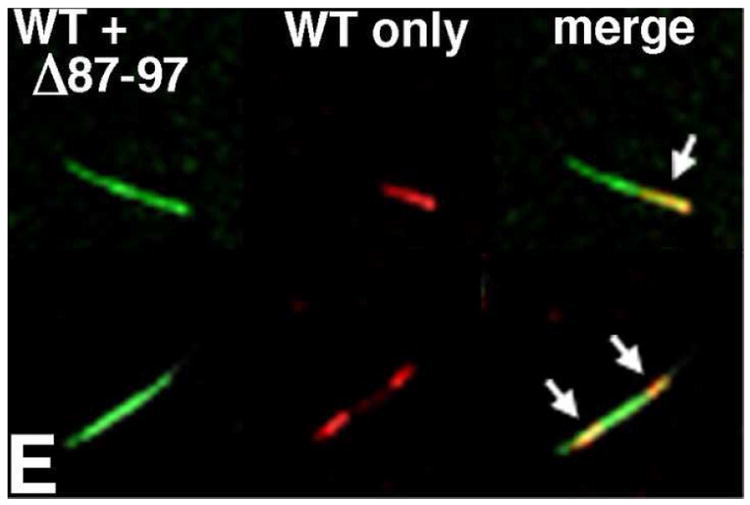
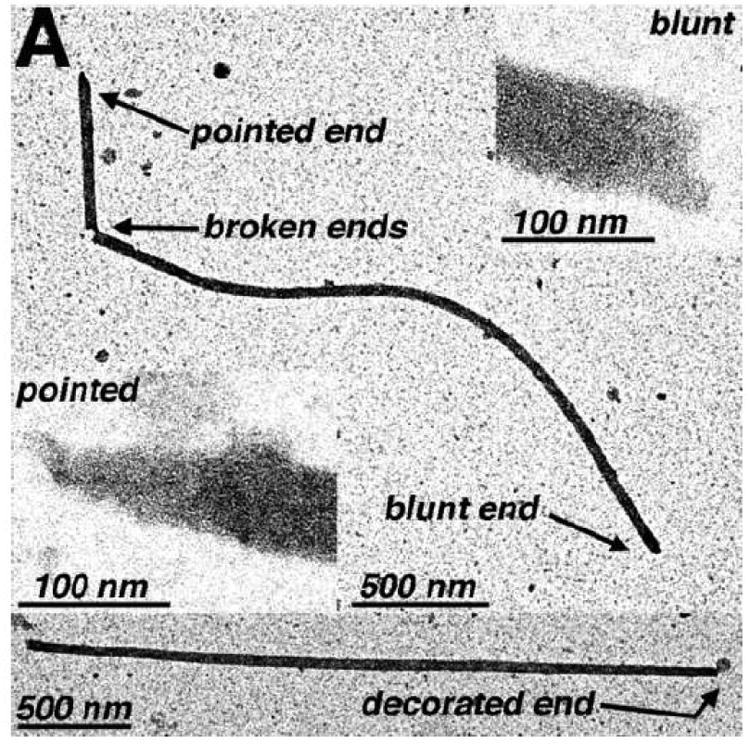
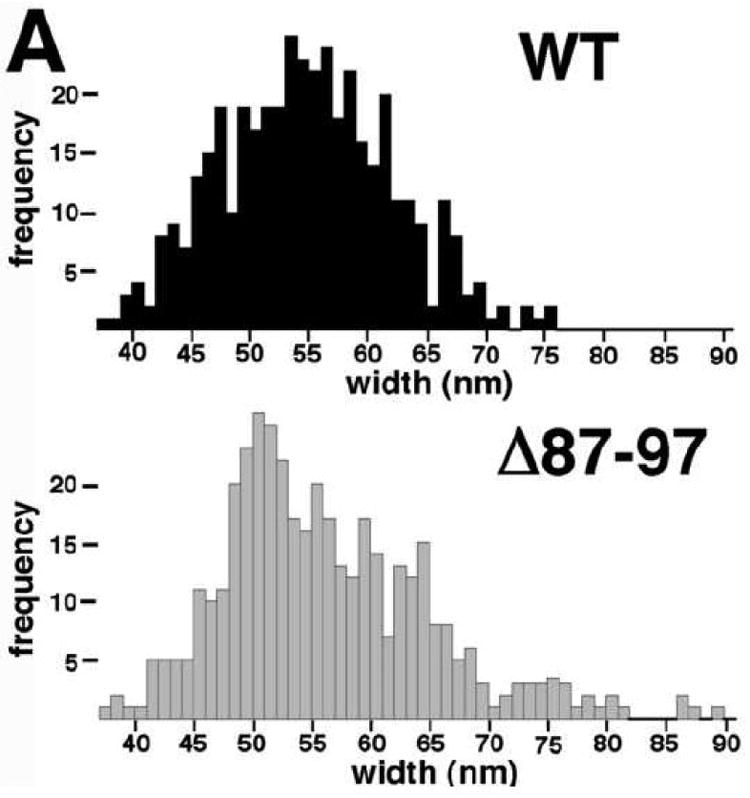
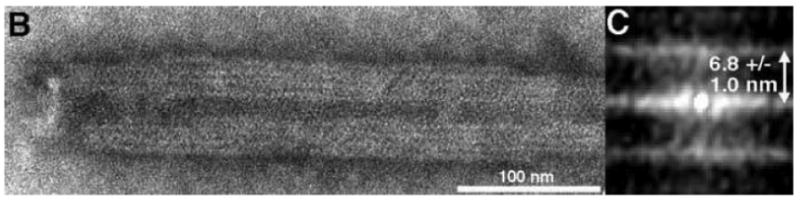
During the morphogenesis of mature human immunodeficiency virus-1 cores, viral capsid proteins assemble conical or tubular shells around viral ribonucleoprotein complexes. This assembly step is mimicked in vitro through reactions in which capsid proteins oligomerize to form long tubes, and this process can be modeled as consisting of a slow nucleation period, followed by a rapid phase of tube growth. We have developed a novel fluorescence microscopy approach to monitor in vitro assembly reactions and have employed it, along with electron microscopy analysis, to characterize the assembly process. Our results indicate that temperature, salt concentration, and pH changes have differential effects on tube nucleation and growth steps. We also demonstrate that assembly can be unidirectional or bidirectional, that growth can be capped, and that proteins can assemble onto the surfaces of tubes, yielding multiwalled or nested structures. Finally, experiments show that a peptide inhibitor of in vitro assembly also can dismantle preexisting tubes, suggesting that such reagents may possess antiviral effects against both viral assembly and uncoating. Our investigations help establish a basis for understanding the mechanism of mature human immunodeficiency virus-1 core assembly and avenues for antiviral inhibition.


Figures

Figure 1
Figure 1. HIV-1 core assembly model
Shown is a model for the in vitro assembly from HIV-1 capsid proteins, in which nucleation limited kinetics are assumed, although this has not been proven rigorously. As illustrated in step 1, protein subunits oligomerize to form a nucleation complex (gray cluster of subunits) that serves to promote the rapid growth of tubes, depicted in steps 2 and 3. Note that although the model shows assembly in one direction, bidirectional assembly is not excluded. Note also that the nature of the subunits that combine to form the nucleation complex, the composition of the nucleation complex, and the sizes of the subunits that are added during the rapid growth phase are unknown.
Figure 2
Figure 2. Analysis of HIV CA assembly reactions by EM and FM
Panels A-D show a comparison of EM and FM methods for visualization of HIV-1 in vitro assembly products. WT (A, C) or Δ87-97 (B, D) capsid proteins at 100 uM were induced to assemble at 4°C in 50 mM Tris pH 8, 1 M NaCl, 5 mM β-mercaptoethanol and then processed for viewing by FM using Hy183 as the primary antibody (A, B), or for viewing by EM, after negatively staining with uranyl acetate (C, D). Size bars for FM and EM images are provided in panels B and C respectively. Panels E and F give tube numbers as determined by FM (E) and EM (F) over a time course under the incubation conditions described above. WT or Δ87-97 capsid proteins were induced to assemble for the indicated amounts of time, after which they were processed for viewing by FM using NEA9306 as the primary antibody, or for EM. Tubes of at least 1.5 micron in length were counted in at least five 14370 micron2 fields of view for FM, and in a total of five 48.4 micron2 fields for EM. For FM tube tabulation, results are given as tubes per field with standard deviations, while for EM tube tabulation, total tube numbers in the five fields are given without standard deviations, due to the limited numbers of tubes observed. Note that for equivalent areas of view, 48 h FM Δ87-97 and WT tube counts were respectively 6.2 and 22.9 times lower than their EM counterparts.
Figure 3
Figure 3. Examination of capsid tube lengths by FM
HIV-1 capsid proteins were assembled and processed for FM as described in Figure 2. Panel A shows an enlarged image, in which tubes of various sizes are evident. Panel B is a black and white binary version of panel A, in which the measured tube lengths (in microns) are shown. Note that the theoretical resolution limit under our imaging conditions was approximately 220 nm, and that our threshold for tube tabulation was 1.5 microns, so as to exclude small fluorescent artifacts from our analyses.
Figure 4
Figure 4. pH dependence of in vitro assembly reactions
WT (A) or Δ87-97 (B) capsid proteins at 100 uM were induced to assemble for 48 h at 4°C in 50 mM Tris, 1 M NaCl, 5 mM β-mercaptoethanol at the indicated pHs, and processed for FM using Hy183 as the primary antibody. Tubes in 3-7 separate images for each incubation condition were counted and measured for lengths, and tube numbers per area (0.1 mm2) in length bins of 1.5-2.5, 2.5-3.5, 3.5-4.5, 4.5-5.5, 5.5-6.5, and >6.5 um are as depicted.
Figure 5
Figure 5. Temperature effects on capsid protein assembly
WT (A, B) or Δ87-97 (C) capsid proteins at 100 uM were induced to assemble in 50 mM Tris pH 8.0, 1 M NaCl, 5 mM β-mercaptoethanol for the indicated times at either 4°C (white bars), 37°C (gray bars), or 37° for 15 min, and then 4°C (black bars). After incubations, samples were processed for FM using Hy183 as the primary antibody. Tubes in 3-7 separate images for each incubation condition were counted and measured for lengths, and tube numbers per area (0.1 mm2) in length bins of 1.5-2.5, 2.5-3.5, 3.5-4.5, 4.5-5.5, 5.5-6.5, and >6.5 um are as depicted.
Figure 6
Figure 6. Effects of varying salt concentration on Δ87-97 CA tube numbers and lengths
Δ87-97 capsid proteins at 100 uM were induced to assemble for 48 h at 4°C in 50 mM Tris pH 8.0, 5 mM β-mercaptoethanol, plus either 1000 (white), 750 (gray), or 500 mM (black) NaCl. After incubations, samples were processed for FM using Hy183 as the primary antibody. Tubes in 3-7 separate images for each incubation condition were counted and measured for lengths, and tube numbers per area (0.1 mm2) in length bins of 1.5-2.5, 2.5-3.5, 3.5-4.5, 4.5-5.5, 5.5-6.5, and >6.5 um are as depicted.
Figure 7
Figure 7. CAI dismantles pre-assembled HIV-1 capsid tubes
Capsid proteins (100 uM Δ87-97 in 50 mM Tris pH 8.0, 1 M NaCl, 5 mM β-mercaptoethanol) were assembled for 48 h at 4°C, and then treated 3 h at 4°C with DMSO (A, B, E, F; 5% final) or CAI (C, D, G, H; 500 uM final) in DMSO. After incubations, samples were processed for EM at low magnification (A, C; size bar in panel C) or high magnification (B, D; size bar in panel D), or for FM (panels E-H; size bar in panel H), using Hy183 as the primary antibody. For panel I, capsid proteins were assembled as above, and then treated 3 h at 4°C with the indicated final micromolar concentrations of CAI in DMSO (5% final). After incubations, samples were processed for FM using Hy183 as the primary antibody and imaged. For each incubation condition, tube assembly was quantified from at least seven separate images by determination of the percentages of each image that were covered by tubes, as described in the Materials and Methods sections. Average tube coverage percentages plus standard deviations are as shown.
Figure 8
Figure 8. EM visualization of assembly products treated with low concentrations of CAI
Capsid proteins (100 uM Δ87-97 in 50 mM Tris pH 8.0, 1 M NaCl, 5 mM β-mercaptoethanol) were assembled for 48 h at 4°C, and then treated 3 h at 4°C with 50 uM CAI (final) in 5% DMSO (final). After incubations, samples were processed for EM. The size bar for all four panels is shown in panel D.
Figure 9
Figure 9. Use of WT-specific antibodies to analyze capsid tubes
In panels A-D, the specificity of antibody 13-102-100 for WT proteins was tested. WT (A, B) or Δ87-97 (C, D) capsid proteins at 100 uM were induced to assemble for 48 h at 4°C in 50 mM Tris pH 8, 5 mM β-mercaptoethanol and either 1.25 M NaCl (WT) or 1 M NaCl (Δ87-97). After assembly reactions, samples were processed for double immunofluorescence labeling using antibody 13-102-100 (WT-specific) that recognizes cyclophilin loop residues 84-94 (used at a 1:4000 dilution), detected with an Alexafluor-594-conjugated secondary antibody (B, D); followed by the CTD-specific antibody Hy183 which recognizes both WT and Δ87-97 proteins, detected with an Alexafluor-488-conjugated secondary antibody (A, C). Panels A and B were taken at identical gain and exposure (100 msec) settings. Panels C and D were taken at identical gain settings and exposure settings of 50 msec (C) and 150 msec (D). Note that the size bar for panels A-D is shown in panel D. For panel E, Δ87-97 capsid proteins at 100 uM were induced to assemble for 24 h at 4°C in 50 mM Tris pH 8, 1 M NaCl, 5 mM β-mercaptoethanol, mixed with an equal volume and concentration of unassembled WT proteins in the same buffer, and incubated an additional 24 h at 4°C. After assembly reactions, samples were processed for double immunofluorescence labeling using WT-specific antibody 13-102-100 (used at a 1:2000 dilution), detected with an Alexafluor-594-conjugated secondary antibody (red); followed by the CTD-specific antibody Hy183 which recognizes both WT and Δ87-97 proteins, detected with an Alexafluor-488-conjugated secondary antibody (green). Fluorescence micrographs were taken of identical fields to visualize all capsid proteins (lefthand side images), or only WT proteins (center images), and merged images are shown on the righthand sides. Fifty examples of tubes capped with WT proteins on one end (top images) were observed; while twenty-two examples of tubes capped at both ends (bottom images) were observed.
Figure 10
Figure 10. Analysis of tube ends
In panel A, examples of tubes with different end morphologies are illustrated. Shown towards the top is a low magnification image of a broken WT capsid tube with a blunt end (upper right inset) and a pointed end (lower left inset). In the bottom low magnification image is a tube with a normal blunt end (left side) and a decorated end, as indicated. Size bars for low magnification images and high magnification insets are 500 nm and 100 nm respectively. In panel B is a tabulation of observed tubes, based on their tube end morphologies. Initially, tube end morphologies of Δ87-97 (gray bars; N=57) and WT (black bars; N=105) tubes were classified as decorated, wide, pointed, and blunt. Decorated ends were defined as having attached electron dense features at the tube ends; wide ends were defined as being >50% wider than their counterpart ends for at least 100 nm of the tube length; blunt and pointed ends were defined as possessing tube end angles of ≥70° or <70° respectively, where tube end angles are the most acute angles measured between lines parallel to tube lengths and lines parallel to the edges that determine tube ends. For the purposes of tabulation, tubes with one decorated end, one pointed end or one wide end were categorized as asymmetric; tubes with two blunt ends were categorized as symmetric blunt; and tubes with two pointed or decorated ends were categorized as symmetric aberrant. Note that in all cases where broken ends were examined (N=19), the opposite ends of the breaks all were categorized as symmetric blunt.
Figure 11
Figure 11. Analysis of WT and Δ87-97 tube widths
In panel A, width measurements (WT N=419; Δ87-97 N=406) from EM images of 102 WT and 103 Δ87-97 tubes were tabulated, and the frequencies of tube measurements falling into different 1 nm size bins are as depicted in the histogram. Note that the average widths of WT and Δ87-97 tubes were calculated as 54 ± 8 nm and 55 ± 9 nm, respectively. Panel B shows an EM image of a multiwalled Δ87-97 tube, while the autocorrelation function calculated from one of the boxed sides of the tube is presented in panel C. Note that the distance between the center line and the upper or lower lines in the autocorrelation function is indicative of the repeat distance between each layer of the tube walls. As shown, the average repeat distance from 16 measurements on 5 separate tubes was 6.8 ± 1.0 nm.

References

    1. Ehrlich L, Agresta B, Carter C. Assembly of recombinant Human Immunodeficiency virus type I capsid protein in vitro. J Virol. 1992;66:4874–4883. - PMC - PubMed
    1. Campbell S, Vogt V. Self-assembly in vitro of purified CA-NC proteins from Rous Sarcoma virus and Human Immunodeficiency virus type I. J Virol. 1995;69:6487–6497. - PMC - PubMed
    1. Gross I, Hohenberg H, Krausslich HG. In vitro assembly properties of purified bacterially expressed capsid proteins of human immunodeficiency virus. Eur J Biochem. 1997;249:592–600. - PubMed
    1. Swanstrom R, Wills J. Synthesis, assembly and processing of viral proteins. In: Coffin J, Hughes S, Varmus H, editors. Retroviruses. Cold Spring Harbor Laboratory Press; NY: 1997. pp. 263–334. - PubMed
    1. Barklis E, McDermott J, Wilkens S, Fuller S, Thompson D. Organization of HIV-1 capsid proteins on a lipid monolayer. J Biol Chem. 1998;273:7177–80. - PubMed

Publication types

LinkOut - more resources