. 2009 Apr;9(4):339-49.
doi: 10.1016/j.cmet.2009.03.002.

CXC ligand 5 is an adipose-tissue derived factor that links obesity to insulin resistance

Affiliations

CXC ligand 5 is an adipose-tissue derived factor that links obesity to insulin resistance

Carine Chavey et al. Cell Metab. 2009 Apr.

Abstract

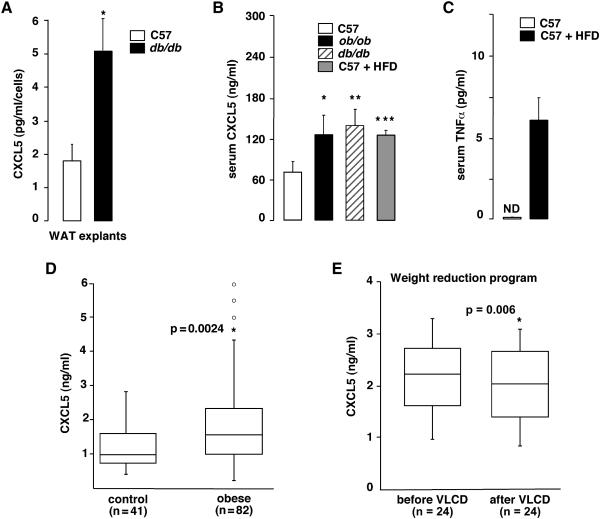
We show here high levels of expression and secretion of the chemokine CXC ligand 5 (CXCL5) in the macrophage fraction of white adipose tissue (WAT). Moreover, we find that CXCL5 is dramatically increased in serum of human obese compared to lean subjects. Conversely, CXCL5 concentration is decreased in obese subjects after a weight reduction program, or in obese non-insulin-resistant, compared to insulin-resistant, subjects. Most importantly we demonstrate that treatment with recombinant CXCL5 blocks insulin-stimulated glucose uptake in muscle in mice. CXCL5 blocks insulin signaling by activating the Jak2/STAT5/SOCS2 pathway. Finally, by treating obese, insulin-resistant mice with either anti-CXCL5 neutralizing antibodies or antagonists of CXCR2, which is the CXCL5 receptor, we demonstrate that CXCL5 mediates insulin resistance. Furthermore CXCR2-/- mice are protected against obesity-induced insulin resistance. Taken together, these results show that secretion of CXCL5 by WAT resident macrophages represents a link between obesity, inflammation, and insulin resistance.


Figures

Figure 1
Figure 1. CXCL5 is expressed by WAT resident macrophages
A. CXCL5 level was measured by ELISA assay in total protein extract of WAT, liver and muscle from 10-weeks-old C57Bl/6 mice (n=4 mice). * p<0.05, **, p<0,01, ***, p<0,001 here and in following figures or otherwise stated. B. WAT from 10-weeks-old C57Bl/6 mice (n=4 mice) were incubated in KRBH buffer for 1h, 3h, or 22h. At each time point, secreted CXCL5 in medium was analyzed by ELISA and normalized by DNA content in tissue. C. CXCL5 mRNA quantification by QPCR in different fractions of isolated human subcutaneous WAT as indicated. SVF: stromal vascular fraction. Quantification of mRNA was normalized by the expression level of rS9, here and in the following figures. D-E. Quantification of relative CXCL5 mRNA levels at the indicated times of 3T3-L1 (D) or human preadipocyte (E) differentiation in three independents experiments. F. aP2 mRNA expression was analyzed by quantitative RT-PCR on 3T3L1 adipocytes differentiated with or without recombinant mouse CXCL5 (50ng/ml). Values in (C), (D), (E) and (F), represent means of three independents experiments.
Figure 2
Figure 2. Obesity increases CXCL5 release from WAT and CXCL5 systemic level
A. Quantification by ELISA methods of CXCL5 secretion by WAT explants from C57Bl/6 and db/db mice (n=3) after 6h in incubation media. Results were normalized by DNA content in tissue. B. Circulating CXCL5 levels were measured by ELISA methods in serum from male control C57Bl/6, db/db, ob/ob, and mice fed with a high fat diet (n=5). C. Circulating TNFα levels were measured by ELISA methods in serum from control C57Bl/6 mice and mice fed with a high fat diet (HFD) for 12 weeks (n=4). D. Quantification of CXCL5 concentration in serum, as measured by ELISA between normal lean (n=41) and obese patients (n=82). E. Quantification of CXCL5 concentration in serum, as measured by ELISA in response to body weight loss during a 4-week very low calorie diet (VLCD) in 24 obese patients.
Figure 3
Figure 3. CXCL5 is involved in insulin resistance
A. Comparative expression of CXCR2 mRNA in WAT, liver and muscle from 6-month-old C57Bl/6 mice (n=3). B. 2-deoxy-glucose uptake in isolated soleus muscles from mice (n=3). Muscle strips were incubated with or without recombinant CXCL5 (100ng/ml) for 1h before stimulation with insulin (10−7M). C. Protein expression of phospho-Akt, and total Akt in whole cells lysates from isolated muscles (upper panel) described in (B) and from primary MEFs (lower panel) as analyzed by Western blotting with anti-phospho-Ser473-Akt and anti-Akt antibodies. Blot are representative of 3 independents experiments. D. Relative mRNA level of SOCS2 in primary MEFs treated or not with CXCL5 (300ng/ml) and cotreated with or without Jak2 inhibitor (AG490 50μM) or CXCR2 inhibitor (SB225002 10-6M). E. Protein expression of phospho-STAT5a/b and total STAT5 in whole cells lysates from primary MEFs treated with or without insulin (10-7M) and/ or CXCL5 (300ng/ml) as analyzed by Western blotting with anti-phospho-Y694/Y699-STAT5a/b and anti-STAT5 antibodies. Blot are representative of 2 independents experiments F. Relative quantification of circulating CXCL5 concentration (fold) in mice (n=10 per group) after 12 days treatment with 20mg/Kg rosiglitazone (rosi) compared to non-treated mice (control). G. CXCL5 serum concentration is increased in obese patients with insulin resistance (n=30), compared to obese non-insulin resistant subjects (n=22). Insulin resistance status was assessed by the HOMA index (non IR: HOMA≤2.6; IR: HOMA≥2.6). H. Quantification of CXCL5 concentration in serum, as measured by ELISA between normal lean (n=9), lipodystrophic patients (n=12) and obese patients (n=11).
Figure 4
Figure 4. Inhibition of CXCL5 action in obese mice improves insulin sensitivity
A-D. Fasting glucose (A-B) and insulin (C-D) in 18-week-old obese HFD fed mice (A-C) and 9-weeks-old db/db mice (B-D) after 7 days of treatment with neutralizing antibody against CXCL5 (anti-CXCL5) or control IgG (cont IgG) (n=10 mice per group). E-H. Glucose clearance after intraperitoneal injection of insulin (0.75U/kg) (E-F)) or glucose (G-H) in animals treated with anti-CXCL5 or control IgG. For the graph E, F and G, glucose values are relative to initial glucose levels. Area under the curve was analyzed (AUC).
Figure 5
Figure 5. Inhibition of CXCR2 signaling improves insulin sensitivity
A-B. Fasting glucose (A) and insulin (B) in 18-week-old HFD fed mice after 9 days of treatment with CXCR2 antagonist, SB225002 (100mg/kg) or vehicle (n=10 mice per group). C-D. Glucose clearance after intraperitoneal injection of insulin (0.75U/kg) (C) or glucose (D) in animals treated with SB225002 or vehicle. Area under the curve was analyzed (AUC).
Figure 6
Figure 6. CXCR2 −/− mice improve insulin sensitivity
A-B. Fasting glucose (A) and insulin (B) in 10-weeks-old CXCR2 −/− and control mice before (chow) and after 7 weeks of high fat diet (HFD)(n=10 mice per group). C. Body weight in control and CXCR2 −/− mice in chow and high fat diet. D. Food intake in control and CXCR2 −/− mice. E-F. Glucose clearance after intraperitoneal injection of insulin (E) or glucose (F) in control and CXCR2 −/− mice under chow or high fat diet. Area under the curve was analyzed (AUC).
Figure 7
Figure 7. CXCL5 expression is regulated by TNFα and rosiglitazone
A. CXCL5 level in conditioned medium of human subcutaneous adipose tissue explants after treatment with vehicle (control) or TNFα (10ng/ml) for 24h (n=3 per group). B. Quantification of relative CXCL5 mRNA levels in WAT from obese ob/ob TNFα receptor −/− mice compared to the control obese mice (n=3 per group) . C-D. CXCL5 levels in WAT (A) from C57Bl/6 mice or THP1 macrophages (B) after treatment with vehicle (control), TNFα (10ng/ml), rosiglitazone (10−6M) or co-treated with TNFα/rosiglitazone for 6h. Secreted CXCL5 in medium was analyzed by ELISA and normalized by DNA tissue content. E. Q-PCR analysis of CXCL5 mRNA in THP-1 macrophages treated as in (C) F. Luciferase activity expressed as relative luciferase units of a 1422 bp DNA fragment of the CXCL5 promoter coupled to the luciferase gene in the absence or in the presence of a PPARγ expression vector in 293T cells treated with vehicle, TNFα (10ng/ml), rosiglitazone (10−6M) or both TNFα/rosiglitazone. Results were normalized to ß galactosidase activity. Values in (C), (D), (E) and (F), represent means of three independents experiments. G. ChIP analysis of the NFkB binding site of the CXCL5 promoter in immunoprecipitated chromatin from THP-1 macrophages either non-treated (cont.) or treated with TNFα, rosi, or a combination of both (upper panel). Chromatin was immunoprecipitated with mock antibody (IgG) or anti p65 antibody as indicated. Quantification of the ChIP analysis in lower panel. Image J software was used to measure the optical density of the bands. Results are corrected by the signal of the corresponding input lanes. Blot is representative of 2 independents experiments.

References

    1. Abella A, Dubus P, Malumbres M, Rane SG, Kiyokawa H, Sicard A, Vignon F, Langin D, Barbacid M, Fajas L. Cdk4 promotes adipogenesis through PPARgamma activation. Cell Metab. 2005;2:239–249. - PubMed
    1. Ahima RS, Flier JS. Adipose tissue as an endocrine organ. Trends Endocrinol Metab. 2000;11:327–332. - PubMed
    1. Annicotte JS, Chavey C, Servant N, Teyssier J, Bardin A, Licznar A, Badia E, Pujol P, Vignon F, Maudelonde T, et al. The nuclear receptor liver receptor homolog-1 is an estrogen receptor target gene. Oncogene. 2005;24:8167–8175. - PMC - PubMed
    1. Annicotte JS, Iankova I, Miard S, Fritz V, Sarruf D, Abella A, Berthe ML, Noel D, Pillon A, Iborra F, et al. Peroxisome proliferator-activated receptor gamma regulates E-cadherin expression and inhibits growth and invasion of prostate cancer. Mol Cell Biol. 2006;26:7561–7574. - PMC - PubMed
    1. Arenberg DA, Keane MP, DiGiovine B, Kunkel SL, Morris SB, Xue YY, Burdick MD, Glass MC, Iannettoni MD, Strieter RM. Epithelial-neutrophil activating peptide (ENA-78) is an important angiogenic factor in non-small cell lung cancer. J Clin Invest. 1998;102:465–472. - PMC - PubMed

Publication types

MeSH terms