. 2009 Jun;109(2):265-75.
doi: 10.1093/toxsci/kfp073. Epub 2009 Apr 7.

Patterns of immunotoxicity associated with chronic as compared with acute exposure to chemical or physical stressors and their relevance with regard to the role of stress and with regard to immunotoxicity testing

Affiliations

Patterns of immunotoxicity associated with chronic as compared with acute exposure to chemical or physical stressors and their relevance with regard to the role of stress and with regard to immunotoxicity testing

Stephen B Pruett et al. Toxicol Sci. 2009 Jun.

Abstract

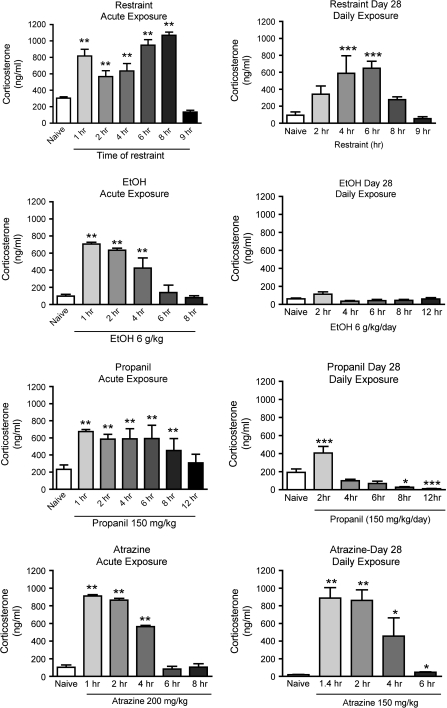
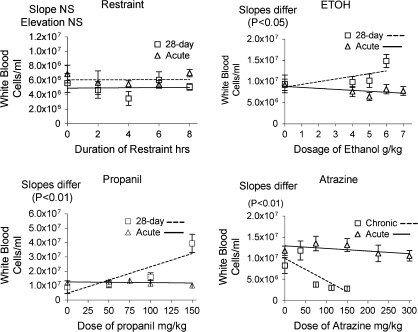
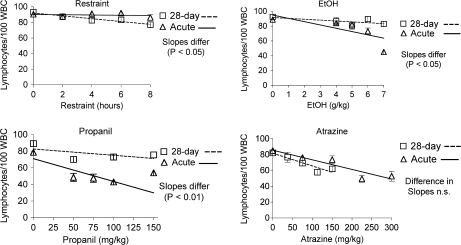
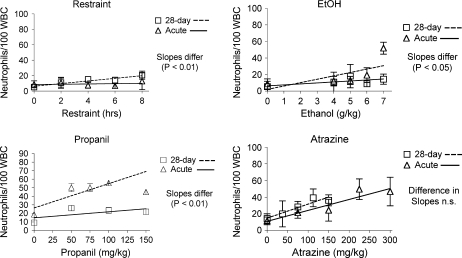
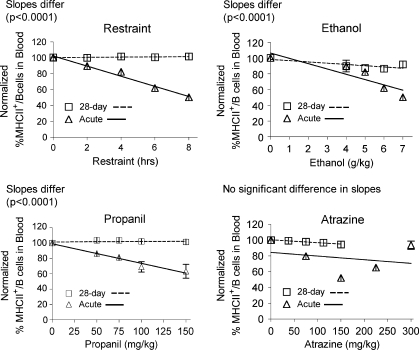
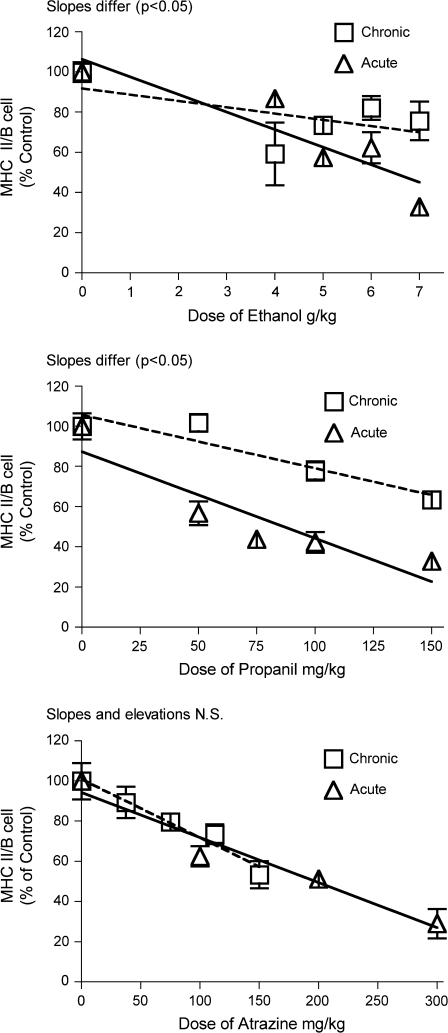
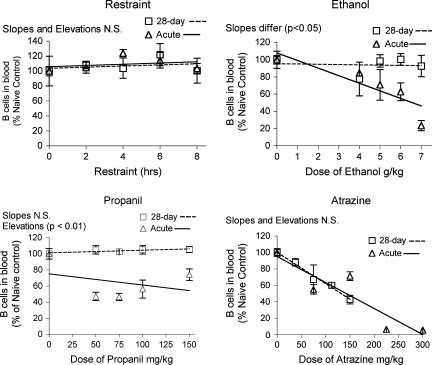
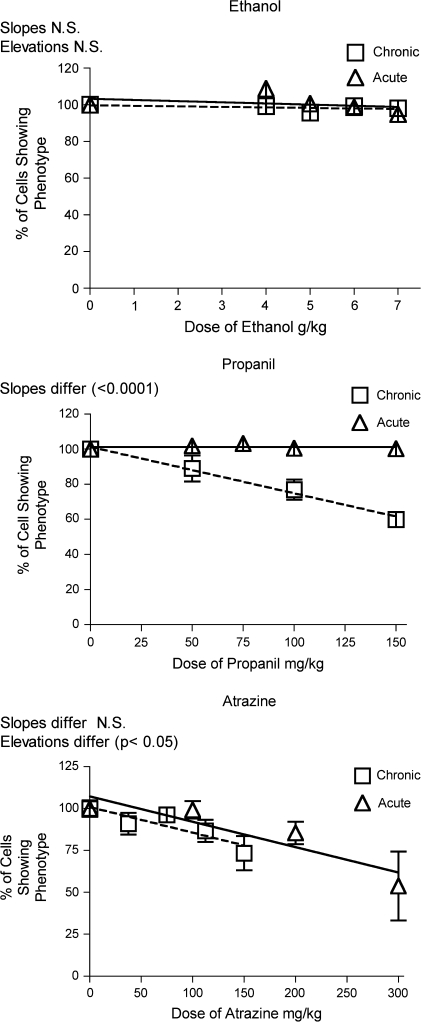
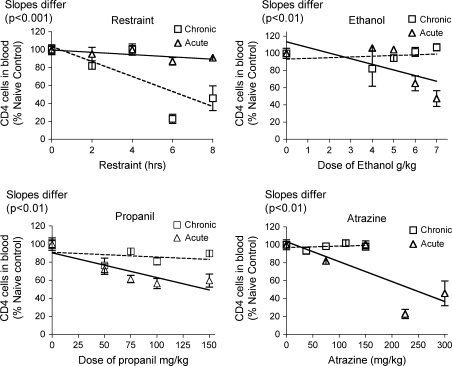
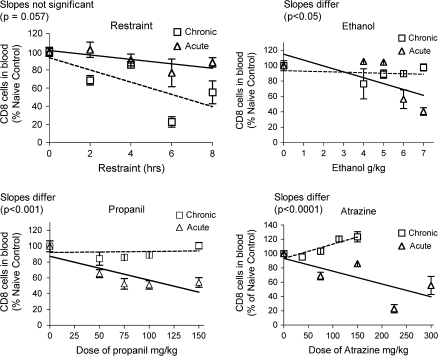
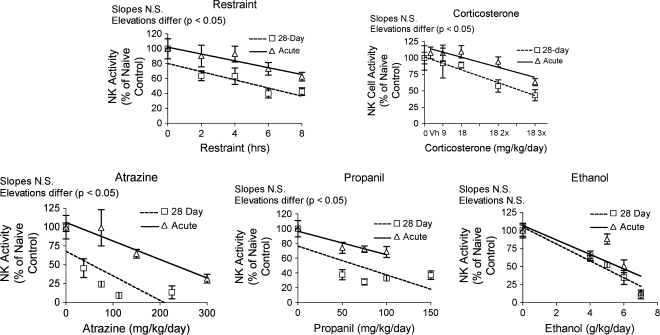
Previous studies have demonstrated that the stress response induced by some drugs and chemicals contributes in a predictable way to alteration of particular immunological parameters in mice. It has not been determined if mice can become tolerant or habituated with regard to the stress response and consequent immunological effects. Addressing this issue was the purpose of the present study. Mice were dosed daily for 28 days with atrazine, ethanol, propanil, or subjected to restraint, which are known to induce neuroendocrine stress responses and thereby to alter several immunological parameters. On day 29, a blood sample was taken and the spleen was removed for analysis of cellular phenotypes, differential cell counts (for blood), and natural killer (NK) cell activity. Corticosterone concentration at various times after dosing (or restraint) was also measured. Comparison of these results with results from previous studies with a single acute exposure revealed that the corticosterone response was almost completely absent in mice treated with ethanol, reduced in mice treated with restraint and propanil, and for atrazine the response was the same as noted for acute exposure. In most cases, the changes in immunological parameters were consistent with expectations based on these corticosterone responses. However, in a few cases (e.g., NK cell activity), it was clear that there were effects not mediated by stress. These results indicate that the nature of the stressor determines whether mice become tolerant with regard to the stress response and consequent immunological effects. This finding has practical implications for safety testing in mice.


Figures

FIG. 1.
FIG. 1.
Corticosterone concentrations in serum samples obtained following acute or 28-day exposure to stressors. Mice were bled at the indicated times after administration of restraint, ethanol (EtOH), propanil, or atrazine. Corticosterone was quantified by radioimmunoassay. In graphs labeled acute exposure, corticosterone was measured after the first administration of the stressor. Results for acute exposure were obtained in previous studies that have been published, and they are shown here to facilitate comparison with the effects of daily exposure. In the graphs labeled Day 28 Daily Exposure, samples were obtained from mice after the 28th daily administration of stressor. Values shown are means ± SEM (n = 5 mice/group). Values significantly different from naive (untreated) control mice are indicated by *p < 0.05, **p < 0.01, or ***p < 0.001.
FIG. 2.
FIG. 2.
WBC counts were counted using an electronic cell counter (Coulter Electronics, Hialeah, FL) 12 h after the last administration of stressor. Values shown were calculated in comparison to the mean of the control (naive) group (= 100%). Values for acute exposure were published previously (Schwab et al., 2005) and are shown here for comparison. A statistical routine implemented by Prism 4.0 software was used to determine if differences in either slope or intercept were significant. If the slope was significantly different for two lines, evaluation of elevation is excluded. Values shown are means ± SEM for groups of five mice each.
FIG. 3.
FIG. 3.
Differential blood lymphocyte counts. Differential counts were determined manually using stained blood smears and compared with previously published data for acute exposures (Schwab et al., 2005). Group size and statistical analysis were as noted in the legend for Figure 2.
FIG. 4.
FIG. 4.
Differential blood neutrophil counts. Differential counts were determined manually using stained blood smears and compared with previously published data for acute exposures (Schwab et al., 2005). Statistical methods and group sizes were as noted in the legend for Figure 2.
FIG. 5.
FIG. 5.
Percentage of MHC class II expression by B lymphocytes in the blood. Blood lymphocytes were identified by flow cytometry after staining with fluorescent-labeled antibodies specific for CD45RA (B220) and MHC class II. Values shown here are expressed as the percentage of MHC expression per B cell normalized so that the control group = 100%. Values for acute exposure were published previously and are shown here for comparison (Schwab et al., 2005). Group size and statistical analysis were as noted in the legend for Figure 2.
FIG. 6.
FIG. 6.
MHC class II expression on B lymphocytes in the spleen. Splenic lymphocytes were identified by flow cytometry after staining with fluorescent-labeled antibodies specific for CD45RA (B220) and MHC class II. Values shown here are expressed as the percentage of MHC expression per B cell normalized so that the control group = 100%. Values for acute exposure were published previously and are shown here for comparison (Pruett et al., 2003). Group size and statistical analysis were as noted in the legend for Figure 2.
FIG. 7.
FIG. 7.
Changes in the percentage of B lymphocytes in the blood. Blood lymphocytes were identified by flow cytometry after staining with fluorescent-labeled antibodies specific for CD45RA (B220). Values shown here are expressed as the percentage of B cells in blood normalized so that the control group = 100%. Values for acute exposure were published previously and are shown here for comparison (Schwab et al., 2005). Group size and statistical analysis are as described in the legend of Figure 2.
FIG. 8.
FIG. 8.
Changes in the percentage of B lymphocytes in the spleen. Splenic lymphocytes were identified by flow cytometry after staining with fluorescent-labeled antibodies specific for CD45RA (B220). Values shown here are expressed as the percentage of B cells in blood normalized so that the control group = 100%. Values for acute exposure were published previously and are shown here for comparison (Pruett et al., 2003). Group size and statistical analysis were done as noted in the legend for Figure 2.
FIG. 9.
FIG. 9.
Changes in CD4+ T lymphocytes in the blood. Changes in the percentage of Blood Th lymphocytes were identified by flow cytometry after staining with fluorescent-labeled antibodies specific for CD4. Values shown here are expressed as the percentage of CD4+ T cells in blood normalized so that the control group = 100%. Values for acute exposure were published previously and are shown here for comparison (Schwab et al., 2005). Group size and statistical analysis were as described in the legend of Figure 2.
FIG. 10.
FIG. 10.
Changes in CD8+ lymphocytes in the blood. Changes in the percentage of CD8+ lymphocytes in the blood were identified by flow cytometry after staining with fluorescent-labeled antibodies specific for CD8. Values shown here are expressed as the percentage of CD8+ T cells in blood normalized so that the control group = 100%. Values for acute exposure were published previously and are shown here for comparison (Schwab et al., 2005). Group size and statistical analysis were as described in the legend of Figure 2.
FIG. 11.
FIG. 11.
Changes in NK cell activity of splenic lymphocytes. Changes in the NK cell activity of splenocytes were assessed using a 51Cr-release assay using YAC-1 tumor target cells. Values shown here are expressed as lytic units normalized so that the mean value for the control group is 100%. Values for acute exposure were published previously and are shown here for comparison (Schwab et al., 2005). Group size and statistical analysis were as described in the legend of Figure 2.

Similar articles

Cited by

References

    1. Anonymous. Health Effects Test Guidelines OPPTS 870.7800 Immunotoxicity, pp. 1–11. 1998 U.S. Environmental Protection Agency, Research Triangle Park, NC.
    1. Anonymous. NTP toxicology and carcinogenesis studies of 2,3,4,7,8-pentachlorodibenzofuran (PeCDF) (CAS No. 57117-31-4) in female Harlan Sprague-Dawley rats (gavage studies) Natl. Toxicol. Program Tech. Rep. Ser. 2006;525:1–198. - PubMed
    1. Bessey PQ, Watters JM, Aoki TT, Wilmore DW. Combined hormonal infusion simulates the metabolic response to injury. Ann. Surg. 1984;200:264–281. - PMC - PubMed
    1. Brenner I, Shek PN, Zamecnik J, Shephard RJ. Stress hormones and the immunological responses to heat and exercise. Int. J. Sports Med. 1998;19:130–143. - PubMed
    1. Carson EJ, Pruett SB. Development and characterization of a binge drinking model in mice for evaluation of the immunological effects of ethanol. Alcohol Clin. Exp. Res. 1996;20:132–138. - PubMed

Publication types

MeSH terms