Comparative Study
. 2009 Apr 8;29(14):4442-60.
doi: 10.1523/JNEUROSCI.6017-08.2009.

Synaptic NMDA receptor activation stimulates alpha-secretase amyloid precursor protein processing and inhibits amyloid-beta production

Affiliations
Comparative Study

Synaptic NMDA receptor activation stimulates alpha-secretase amyloid precursor protein processing and inhibits amyloid-beta production

Sarah E Hoey et al. J Neurosci. .

Abstract

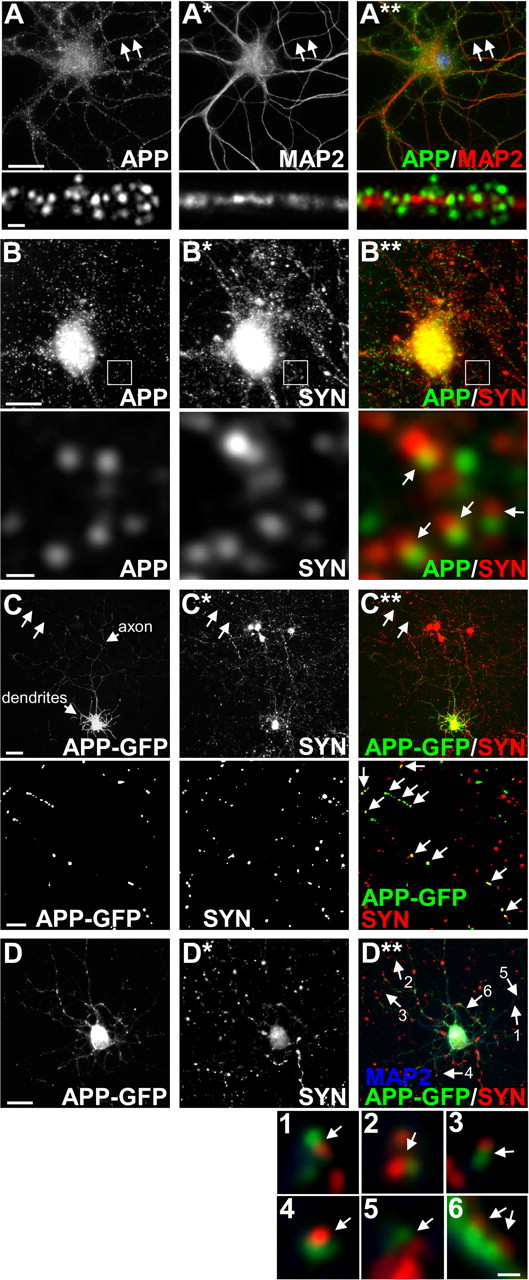
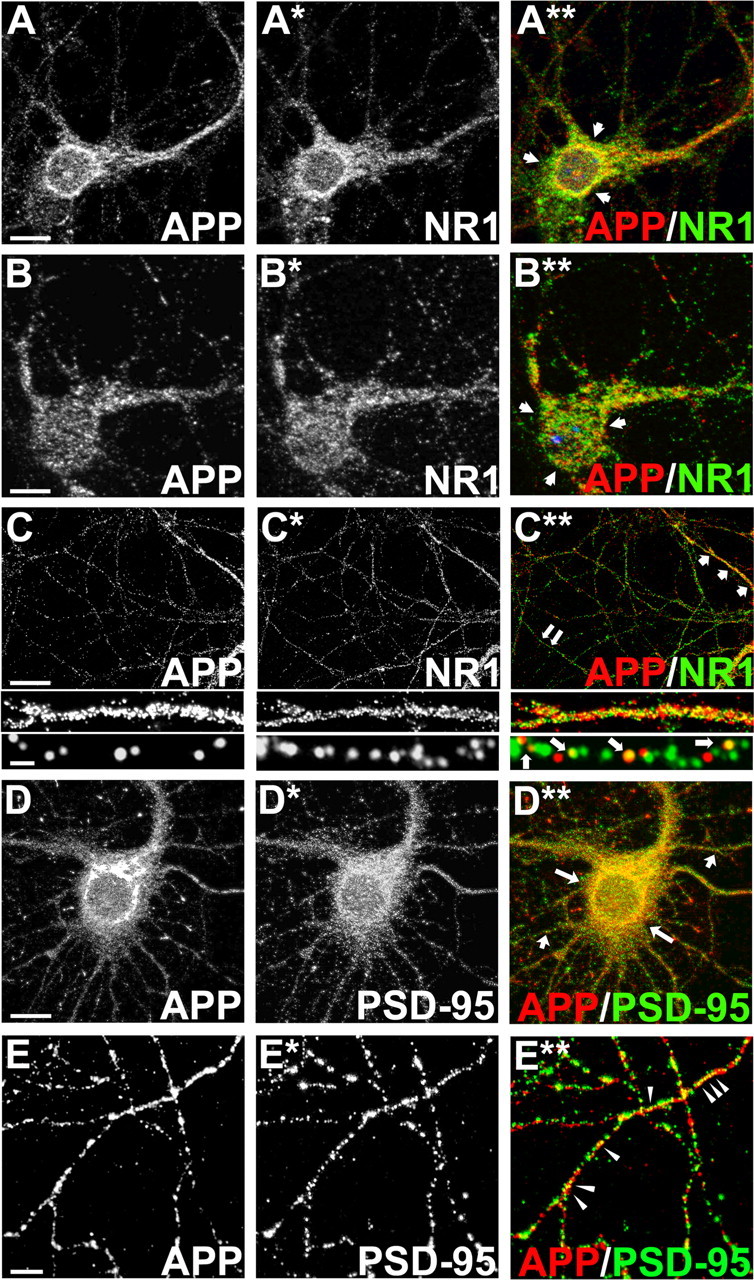
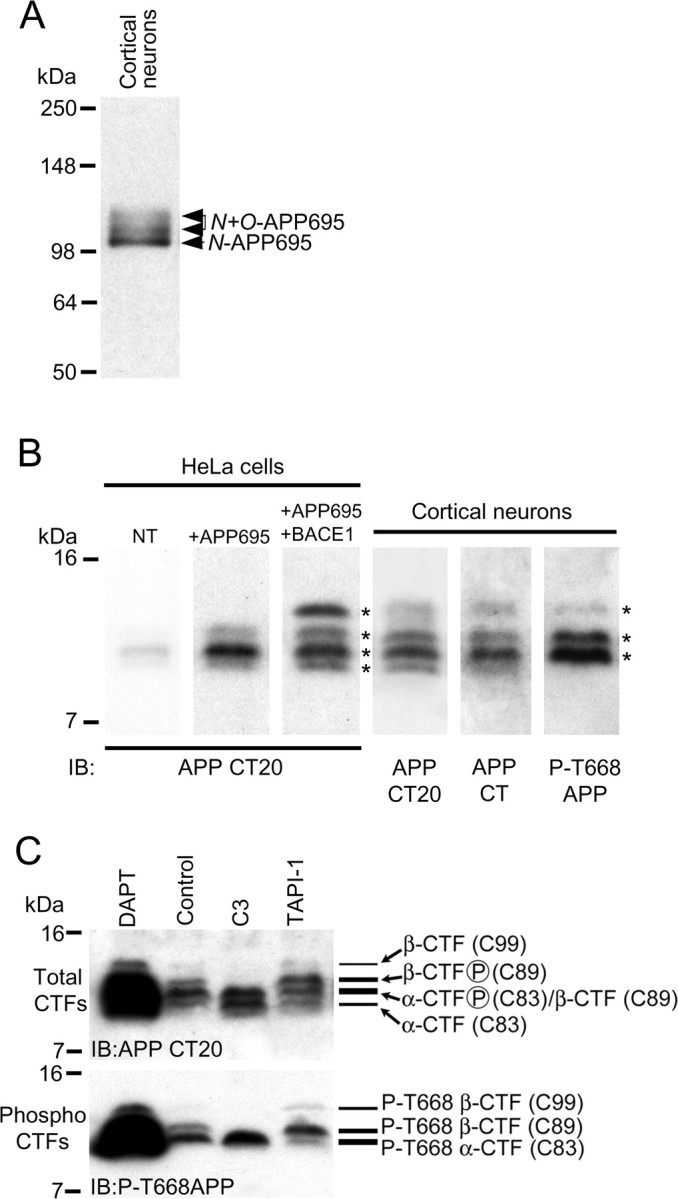
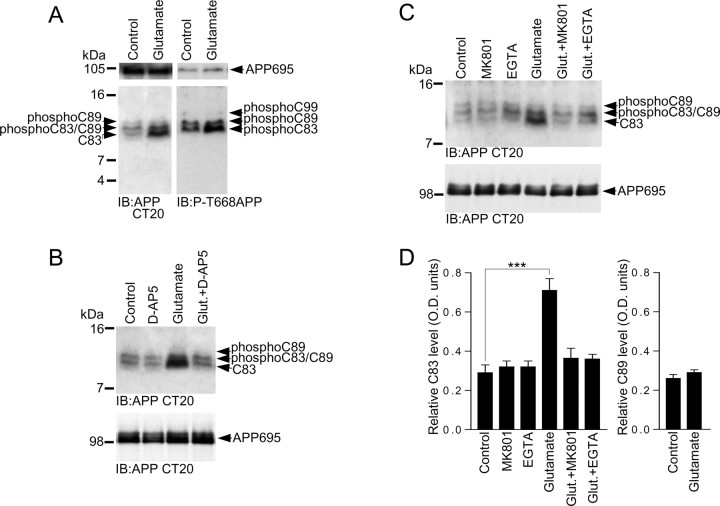
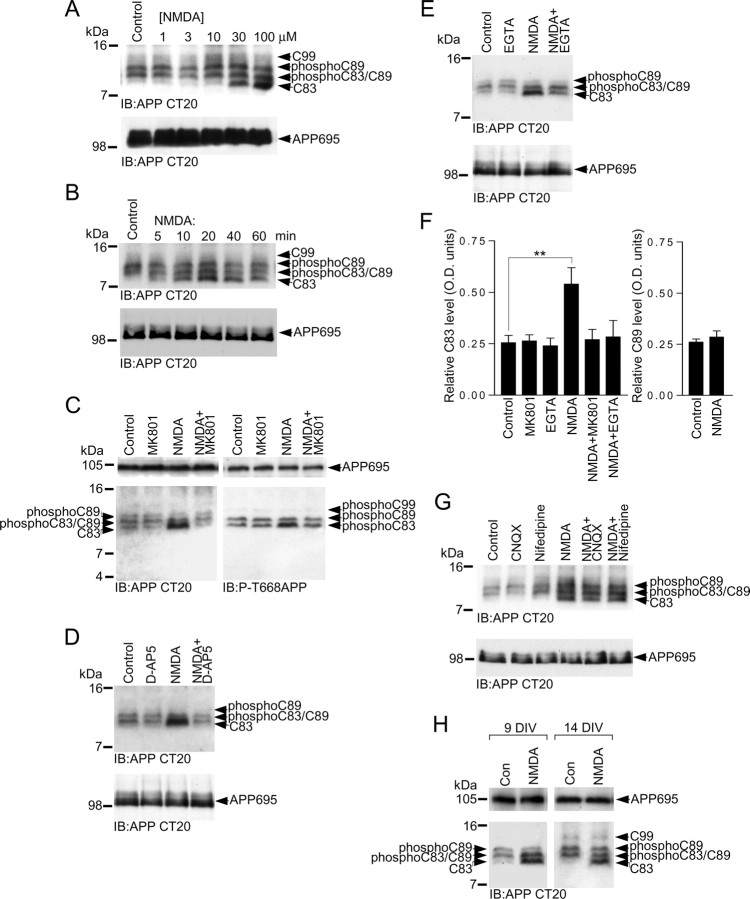
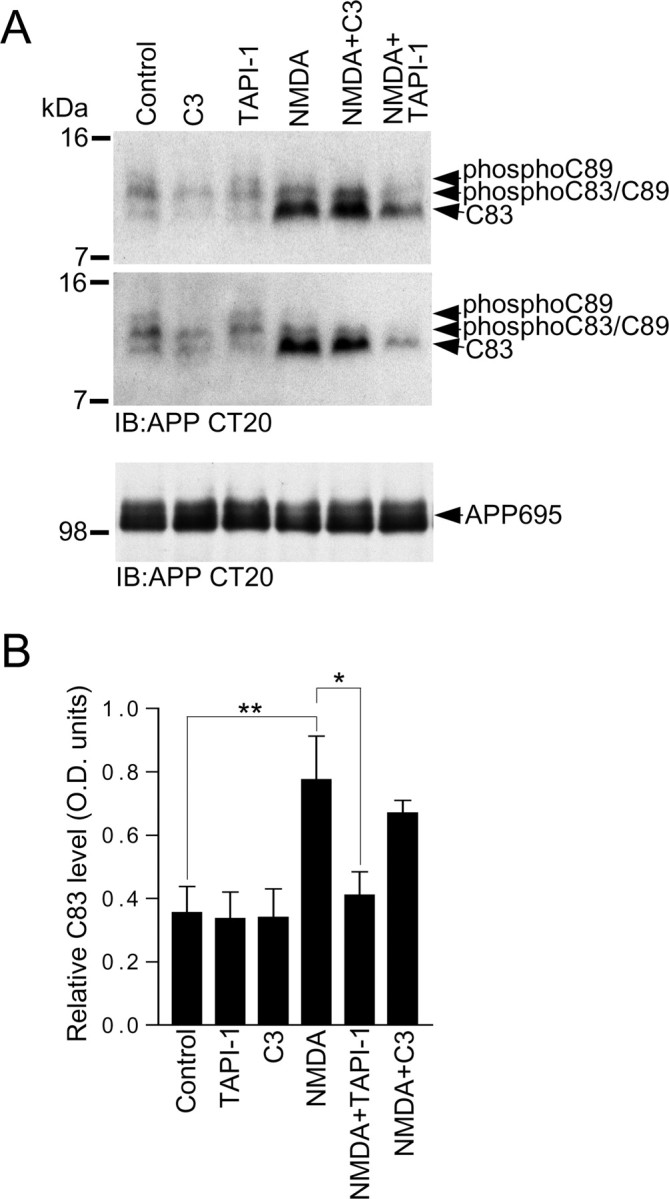
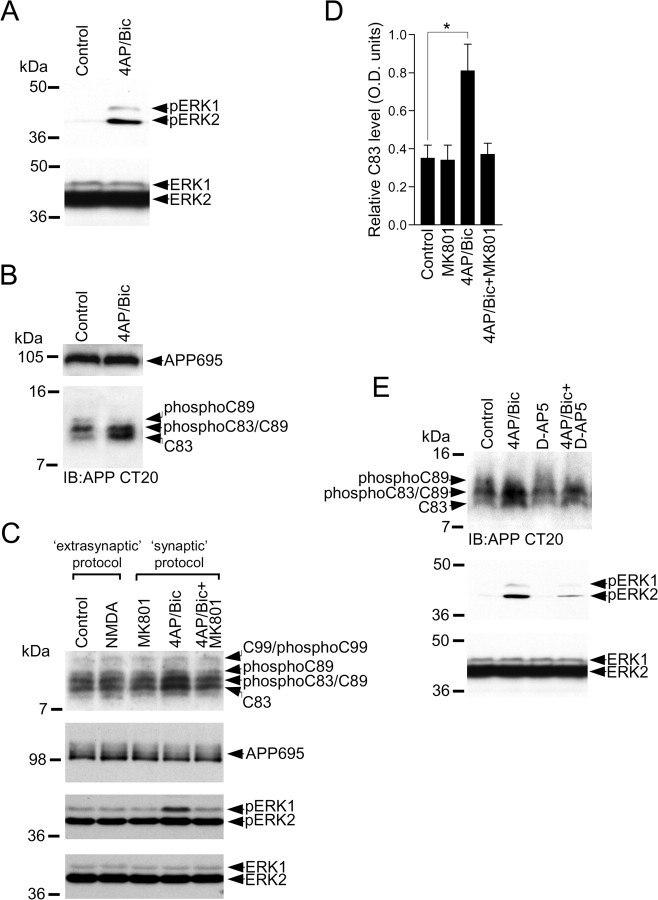
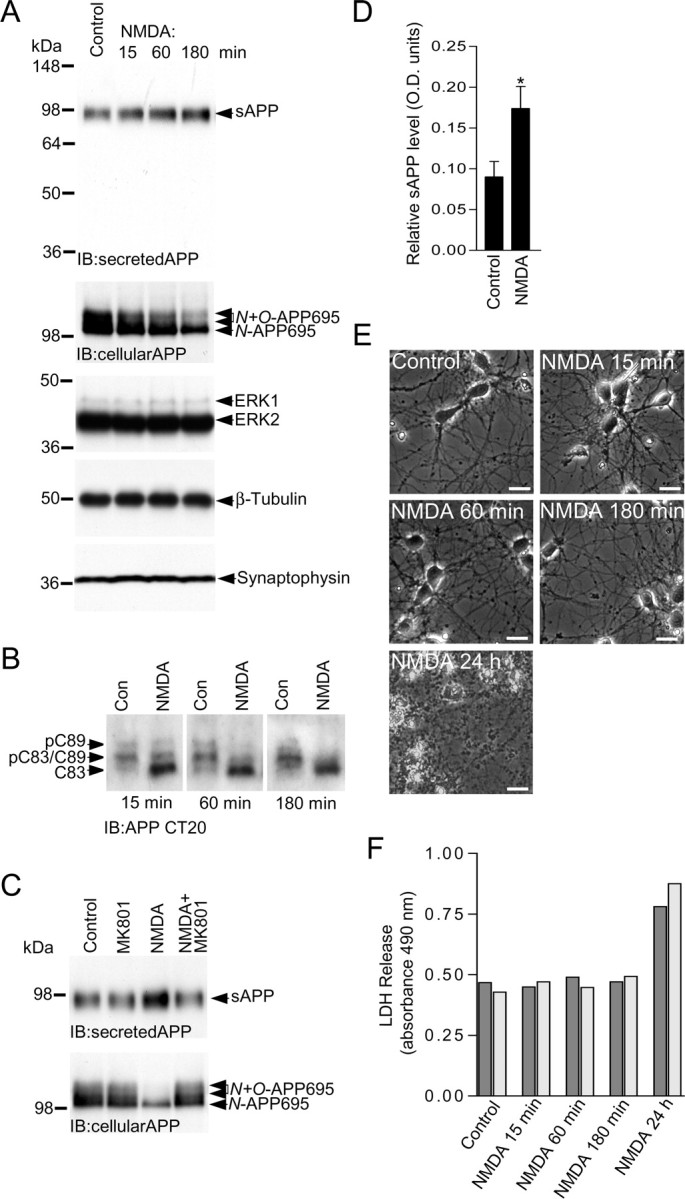
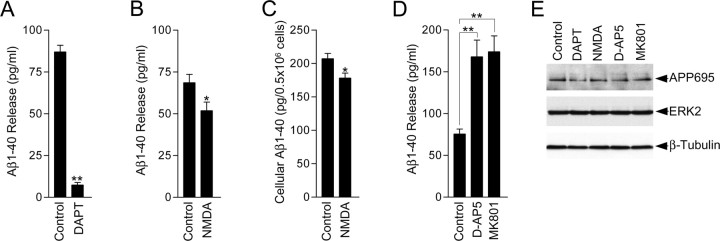
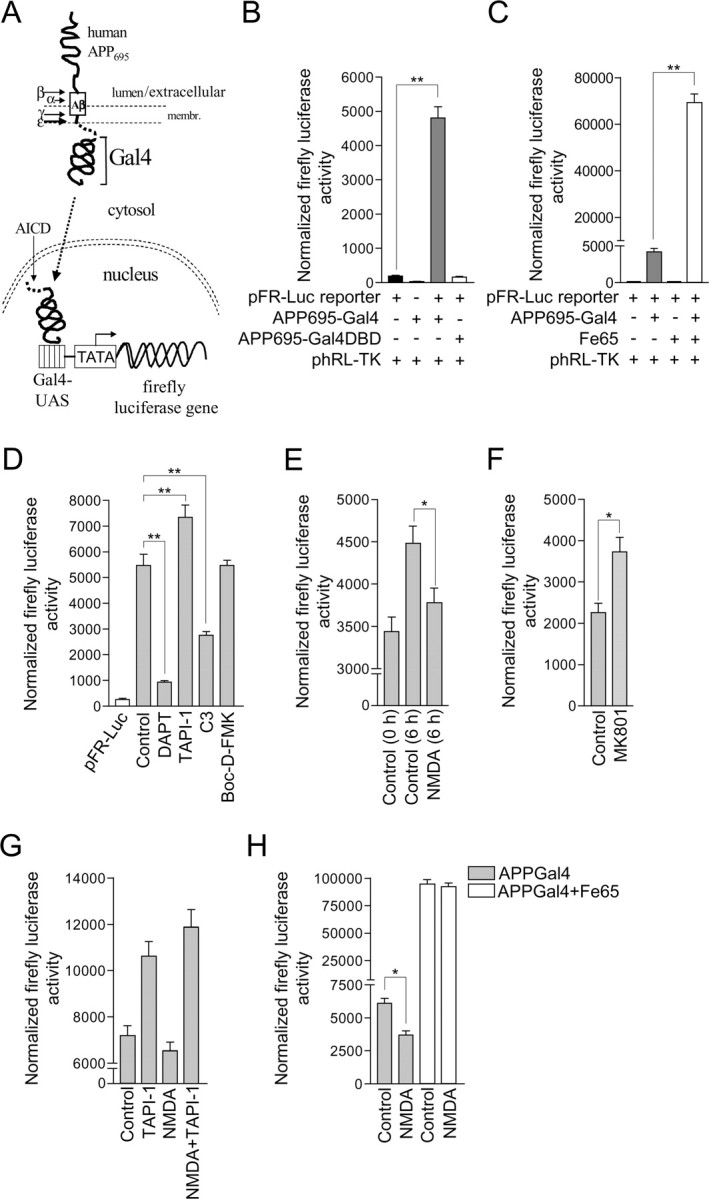
Altered amyloid precursor protein (APP) processing leading to increased production and oligomerization of Abeta may contribute to Alzheimer's disease (AD). Understanding how APP processing is regulated under physiological conditions may provide new insights into AD pathogenesis. Recent reports demonstrate that excitatory neural activity regulates APP metabolism and Abeta levels, although understanding of the molecular mechanisms involved is incomplete. We have investigated whether NMDA receptor activity regulates APP metabolism in primary cultured cortical neurons. We report that a pool of APP is localized to the postsynaptic compartment in cortical neurons and observed partial overlap of APP with both NR1 and PSD-95. NMDA receptor stimulation increased nonamyloidogenic alpha-secretase-mediated APP processing, as measured by a 2.5-fold increase in cellular alpha-C-terminal fragment (C83) levels after glutamate or NMDA treatment. This increase was blocked by the NMDA receptor antagonists d-AP5 and MK801 but not by the AMPA receptor antagonist CNQX or the L-type calcium channel blocker nifedipine, was prevented by chelation of extracellular calcium, and was blocked by the alpha-secretase inhibitor TAPI-1. Cotreatment of cortical neurons with bicuculline and 4-AP, which stimulates glutamate release and activates synaptic NMDA receptors, evoked an MK801-sensitive increase in C83 levels. Furthermore, NMDA receptor stimulation caused a twofold increase in the amount of soluble APP detected in the neuronal culture medium. Finally, NMDA receptor activity inhibited both Abeta1-40 release and Gal4-dependent luciferase activity induced by beta-gamma-secretase-mediated cleavage of an APP-Gal4 fusion protein. Altogether, these data suggest that calcium influx through synaptic NMDA receptors promotes nonamyloidogenic alpha-secretase-mediated APP processing.


Figures

Figure 1.
Figure 1.
APP is trafficked to both presynaptic and postsynaptic compartments in primary cortical neurons. A–B**, Double immunofluorescence staining of primary cultured cortical neurons at 14 DIV. Neurons were fixed and double immunostained for APP and MAP2 (A–A**), and APP and the presynaptic marker synaptophysin (SYN) (B–B**). A**, Image overlay showing localization of cell surface APP to MAP2-positive dendrites. Cell surface APP was labeled with mouse monoclonal APP Ab 22C11 that recognizes the N terminus of APP, followed by cell permeabilization and labeling of MAP2 with a MAP2 rabbit pAb. Bottom, Higher-magnification image of area indicated by white arrows in top panel. B**, Image overlay showing a pool of cell surface APP is apposed to SYN-immunoreactive puncta, suggesting that APP is trafficked to synapses in primary cortical neurons. Cell surface APP was labeled with mouse monoclonal APP Ab 22C11 that recognizes the N terminus of APP, followed by cell permeabilization and labeling of SYN with a SYN rabbit pAb. Examples of APP-positive puncta adjacent to SYN are shown in the bottom panel (white arrows), which is a higher-magnification image of the area indicated by the white box in the top panel. C–C** and D–D**, A plasmid encoding for APP-GFP (1 μg) was transfected into primary cortical neurons at 8 DIV using Lipofectamine 2000 (1 μl). Immunofluorescence labeling for SYN was performed 24 h after transfection. Only neurons expressing low to moderate levels of APP-GFP were analyzed. Images were captured from areas in which there was only a single neuron expressing APP-GFP (when using a 20× objective). C–C**, Image series showing colocalization of axonal APP-GFP with SYN, suggesting that a pool of APP is trafficked to presynaptic nerve terminals in primary cortical neurons. C, Top, Low-magnification image of a neuron expressing APP-GFP; axonal and dendritic arborizations are indicated. C**, Image overlay showing colocalization of axonal APP-GFP with SYN. Bottom, Higher-magnification image of the axon region indicated by two white arrows in the top panel. Discrete APP-GFP and SYN-positive puncta are visible; colocalization of APP-GFP with SYN is indicated by numerous white arrows in bottom panel. D–D**, Image series showing dendritic APP-GFP apposed to SYN-immunoreactive puncta, suggesting that a pool of APP-GFP is trafficked to synapses in primary cortical neurons. D**, Image overlay showing a pool of dendritic APP-GFP is apposed to SYN-immunoreactive puncta. Neurons were also immunostained for MAP2 to reveal dendrites (blue). Examples of APP-GFP puncta adjacent to SYN are shown in panels 1–6, which are higher-magnification images of the dendritic regions indicated by numbered arrows in D**. Scale bars: A, B, 20 μm (top), 1 μm (bottom); C, 50 μm (top), 5 μm (bottom); D, 25 μm (top), 1 μm (panels 1–6).
Figure 2.
Figure 2.
APP is expressed in primary cortical glutamatergic neurons. A–E**, Double immunofluorescence staining of primary cultured cortical neurons at 14 DIV. Neurons were fixed and double immunostained for APP and NR1 (A–A**, B–B**, C–C**), and APP and PSD-95 (D–D**, E–E**). A**, Mid Z-stack image overlay showing partial overlap of APP with NR1 in the intracellular compartment, as indicated by white arrows. B**, Top Z-stack image overlay showing partial overlap of APP with NR1 in the somatodendritic compartment, as indicated by white arrows. C**, Image overlay showing partial overlap of APP with NR1 in neuritic processes. Middle, Higher-magnification image of area indicated by three white arrows (top right of top panel). Bottom, Higher-magnification image of area indicated by two white arrows (bottom left of top panel). D**, Image overlay showing partial overlap of APP with PSD-95, as indicated by white arrows. E**, Image overlay showing partial overlap of APP with PSD-95 in neuritic processes, as indicated by white arrowheads. Scale bars: A, B, 10 μm; C, 20 μm (top), 1 μm (bottom); D, 10 μm; E, 5 μm.
Figure 3.
Figure 3.
Characterization of APP and APP CTFs in primary cultured cortical neurons. A, Lysate prepared from primary cultured cortical neurons at 10 DIV was immunoblotted with APP Ab CT20. Bands representing N-linked (immature) and N+O-linked (mature) APP695 are indicated. B, Cell extracts prepared from nontransfected HeLa cells (NT), HeLa cells transfected with a plasmid encoding for APP695 (+APP695), or HeLa cells cotransfected with plasmids encoding for APP695 and BACE1 (+APP695+BACE1), were resolved by 16.5% Tris-tricine SDS-PAGE and immunoblotted with APP Ab CT20. Cell extracts prepared from primary cultured cortical neurons at 10 DIV were resolved by 16.5% Tris-tricine SDS-PAGE and immunoblotted with APP Ab CT20, a commercial APP C-terminal Ab (APP CT), or phospho-APP (thr668) Ab (P-T668APP). APP CTF bands are indicated by asterisks. C, Primary cultured cortical neurons at 10 DIV were treated with DMSO (control), 2 μm DAPT, 10 μm BACE1 inhibitor C3, or 50 μm TAPI-1 for 3 h followed by immunoblotting of cell extracts with APP Ab CT20 to detect total (unphosphorylated and phosphorylated) APP CTFs (top) or phospho-APP (Thr668) Ab (P-T668APP) to detect phospho-CTFs (bottom).
Figure 4.
Figure 4.
Glutamate increases α-CTF (C83) levels in primary cultured cortical neurons. A, Primary cultured cortical neurons at 10 DIV were treated with vehicle (control) or 20 μm glutamate for 15 min followed by immunoblotting of neuronal lysates with APP Abs CT20 or phospho-APP (thr668) (P-T668APP). B, Primary cultured cortical neurons at 10 DIV were treated with vehicle (control), 100 μm d-AP5, 20 μm glutamate, or 20 μm glutamate in the presence of 100 μm d-AP5 (Glut.+D-AP5) for 15 min followed by immunoblotting of neuronal lysates with APP Ab CT20. C, Primary cultured cortical neurons at 10 DIV were treated with vehicle (control), 2 μm MK801, 2 mm EGTA, 20 μm glutamate, 20 μm glutamate in the presence of 2 μm MK801 (Glut.+MK801), or 20 μm glutamate in the presence of 2 mm EGTA (Glut.+EGTA) for 15 min followed by immunoblotting of neuronal lysates with APP Ab CT20. D, C83 levels in cortical neurons treated with vehicle (control), MK801, EGTA, glutamate, glutamate in the presence of MK801 (Glut.+MK801), and glutamate in the presence of EGTA (Glut.+EGTA), and C89 levels in cortical neurons treated with vehicle (control) or glutamate, were analyzed by ECL protein band densitometry using calibrated ImageJ software. Each column is the mean ± SEM of six independent experiments (n = 6; ***p < 0.001, control vs glutamate, one-way ANOVA with Bonferroni post test).
Figure 5.
Figure 5.
NMDA receptor activity increases α-CTF (C83) levels in primary cultured cortical neurons. A, Primary cultured cortical neurons at 10 DIV were treated with vehicle (control) or 1, 3, 10, 30, and 100 μm NMDA for 15 min followed by immunoblotting of neuronal lysates with APP Ab CT20. B, Primary cultured cortical neurons at 10 DIV were treated with vehicle (control) or 50 μm NMDA for 5, 10, 20, 40, and 60 min followed by immunoblotting of neuronal lysates with APP antibody CT20. C, Primary cultured cortical neurons at 10 DIV were treated with vehicle (control), 2 μm MK801, 50 μm NMDA, or 50 μm NMDA in the presence of 2 μm MK801 (NMDA+MK801) for 15 min followed by immunoblotting of neuronal lysates with APP Abs CT20 or phospho-APP (thr668) (P-T668APP). D, Primary cultured cortical neurons at 10 DIV were treated with vehicle (control), 100 μm d-AP5, 50 μm NMDA, or 50 μm NMDA in the presence of 100 μm d-AP5 (NMDA+D-AP5) for 15 min followed by immunoblotting of neuronal lysates with APP Ab CT20. E, Primary cultured cortical neurons at 10 DIV were treated with vehicle (control), 2 mm EGTA, 50 μm NMDA, or 50 μm NMDA in the presence of 2 mm EGTA (NMDA+EGTA) for 15 min followed by immunoblotting of neuronal lysates with APP Ab CT20. F, C83 levels in cortical neurons treated with vehicle (control), MK801, EGTA, NMDA, NMDA in the presence of MK801 (NMDA+MK801), and NMDA in the presence of EGTA (NMDA+EGTA), and C89 levels in cortical neurons treated with vehicle (control) or NMDA, were analyzed by ECL protein band densitometry using calibrated ImageJ software. Each column is the mean ± SEM of six independent experiments (n = 6; **p < 0.01, control vs NMDA, one-way ANOVA with Bonferroni post test). G, Primary cultured cortical neurons at 10 DIV were treated with vehicle (control), 50 μm CNQX, 10 μm nifedipine, 50 μm NMDA, 50 μm NMDA in the presence of 50 μm CNQX (NMDA+CNQX), or 50 μm NMDA in the presence of 10 μm nifedipine (NMDA+Nifedipine) for 15 min followed by immunoblotting of neuronal lysates with APP Ab CT20. H, Primary cultured cortical neurons at 10 DIV or 14 DIV were treated with vehicle (Con) or 50 μm NMDA for 15 min followed by immunoblotting of neuronal lysates with APP Ab CT20.
Figure 6.
Figure 6.
The α-secretase inhibitor TAPI-1 blocks the NMDA-receptor-mediated increase in C83 levels. A, Primary cortical neurons at 10 DIV were treated with vehicle (control), 10 μm BACE1 inhibitor C3, 50 μm TAPI-1, 50 μm NMDA, 50 μm NMDA in the presence of 10 μm C3 (NMDA+C3), or 50 μm NMDA in the presence of 50 μm TAPI-1 (NMDA+TAPI-1) for 15 min followed by immunoblotting of neuronal lysates with APP antibody CT20. Two immunoblots generated from independent experiments are shown. B, C83 levels were analyzed by ECL protein band densitometry using calibrated ImageJ software. Each column is the mean ± SEM value of four independent experiments (n = 4; **p < 0.01, control vs NMDA, *p < 0.05, NMDA vs NMDA+TAPI-1, one-way ANOVA with Bonferroni post test).
Figure 7.
Figure 7.
Synaptic NMDA receptor activity increases C83 levels in primary cultured cortical neurons. A, Primary cultured cortical neurons at 10 DIV were treated with vehicle (control) or 1 mm 4-AP and 25 μm bicuculline (4-AP/Bic) for 15 min followed by immunoblotting of neuronal lysates with phospho-ERK1/ERK2 (pERK1/pERK2) and ERK1/ERK2 Abs. B, Primary cultured cortical neurons at 10 DIV were treated with vehicle (control) or 1 mm 4-AP and 25 μm bicuculline (4-AP/Bic) for 15 min followed by immunoblotting of neuronal lysates with APP antibody CT20. C, Extrasynaptic NMDA receptor activation protocol: primary cultured cortical neurons at 10 DIV were treated with 1 mm 4-AP, 25 μm bicuculline and 5 μm MK801 for 5 min to activate and block synaptic NMDA receptors, followed by washout of unbound MK801 and bath application of vehicle (control) or 50 μm NMDA for 15 min; synaptic NMDA receptor activation protocol: primary cultured cortical neurons were treated with 2 μm MK801, 1 mm 4-AP and 25 μm bicuculline (4-AP/Bic), or 1 mm 4-aminopyridine and 25 μm bicuculline in the presence of 2 μm MK801 (4-AP/Bic+MK801) for 15 min. Neuronal lysates were prepared and immunoblotted with APP Ab CT20 to detect APP CTFs and APP695, and also with phospho-ERK1/ERK2 (pERK1/pERK2) and ERK1/ERK2 antibodies. D, C83 levels in cortical neurons treated with vehicle (control), MK801, 4-AP/Bic, and 4-AP/Bic in the presence of MK801 (4-AP/Bic+MK801) were analyzed by ECL protein band densitometry using calibrated ImageJ software. Each column is the mean ± SEM value of five independent experiments (n = 5; *p < 0.05, control vs 4-AP/Bic, one-way ANOVA with Bonferroni post test). E, Primary cultured cortical neurons at 10 DIV were treated with vehicle (control), 1 mm 4-AP and 25 μm bicuculline (4-AP/Bic), 100 μm d-AP5, or 1 mm 4-aminopyridine and 25 μm bicuculline in the presence of 100 μm d-AP5 (4-AP/Bic+D-AP5) for 15 min followed by immunoblotting of neuronal lysates with APP Ab CT20 to detect CTFs. Neuronal lysates were also immunoblotted with phospho-ERK1/ERK2 (pERK1/pERK2) and ERK1/ERK2 Abs.
Figure 8.
Figure 8.
NMDA receptor activity stimulates sAPP release from primary cultured cortical neurons. A, Primary cultured cortical neurons at 10 DIV were treated with vehicle (control) or 50 μm NMDA for 15, 60, and 180 min followed by immunoblotting of samples of the neuronal culture medium with APP N-terminal Ab 13-M to detect secreted APP, and immunoblotting of neuronal lysates with APP CT20 (cellular APP), ERK1/ERK2, β-tubulin, and synaptophysin Abs. B, Primary cultured cortical neurons at 10 DIV were treated with vehicle (Con) or 50 μm NMDA for 15, 60, and 180 min followed by immunoblotting of neuronal lysates with APP Ab CT20 to detect APP CTFs. C, Primary cultured cortical neurons at 10 DIV were treated with vehicle (control), 2 μm MK801, 50 μm NMDA, or 50 μm NMDA in the presence of 2 μm MK801 (NMDA+MK801) for 180 min followed by immunoblotting of samples of the neuronal culture medium with APP N-terminal Ab 13-M to detect secreted APP, and immunoblotting of neuronal lysates with APP Ab CT20 to detect cellular APP. D, sAPP levels in the neuronal culture medium under basal (control) conditions and after treatment with NMDA for 180 min were analyzed by ECL protein band densitometry using calibrated ImageJ software. Each column is the mean ± SEM of four independent experiments (n = 4; *p < 0.05, control vs NMDA, unpaired two-tailed Student's t test). E, Primary cultured cortical neurons at 10 DIV were treated with vehicle (control) or 50 μm NMDA for 15 min, 60 min, 180 min, and 24 h, and then photographed under phase contrast microscopy (320× magnification). Scale bars, 20 μm. F, Primary cultured cortical neurons at 10 DIV were treated with vehicle (control) or 50 μm NMDA for 15 min, 60 min, 180 min, and 24 h, and the levels of LDH in the neuronal cell culture medium (LDH release) determined as described in Materials and Methods. All treatments were performed in duplicate as indicated by dark gray and light gray bars.
Figure 9.
Figure 9.
NMDA receptor activity modulates Aβ1-40 release from primary cultured neurons. A, Primary cultured cortical neurons at 10 DIV were treated with vehicle (control) or 2 μm DAPT for 6 h, and the neuronal culture medium was removed and processed for measurement of Aβ1-40 levels using a mouse/rat Aβ1-40 ELISA kit as detailed in Materials and Methods. Each column is the mean ± SEM of four independent treatments (n = 4; **p < 0.01, control vs DAPT, unpaired two-tailed Student's t test). B, Primary cultured cortical neurons at 10 DIV were treated with vehicle (control) or 50 μm NMDA for 6 h, and the neuronal culture medium was removed and processed for measurement of Aβ1-40 levels using a mouse/rat Aβ1-40 ELISA kit as detailed in Materials and Methods. Each column is the mean ± SEM of 18 independent treatments (n = 18; *p < 0.05, control vs NMDA, unpaired two-tailed Student's t test). C, Primary cultured cortical neurons at 10 DIV were treated with vehicle (control) or 50 μm NMDA for 6 h and processed for measurement of intracellular Aβ1-40 levels using a mouse/rat Aβ1-40 ELISA kit as detailed in Materials and Methods. Each column is the mean ± SEM of six independent treatments (n = 6; *p < 0.05, control vs NMDA, unpaired two-tailed Student's t test). D, Primary cultured cortical neurons at 10 DIV were treated with vehicle (control), 100 μm d-AP5, or 2 μm MK801 for 6 h, and the neuronal culture medium was removed and processed for measurement of Aβ1-40 levels using a mouse/rat Aβ1-40 ELISA kit as detailed in Materials and Methods. Each column is the mean ± SEM of nine independent treatments (n = 9; **p < 0.01, control vs d-AP5 and control vs MK801, one-way ANOVA with Bonferroni post test). E, Primary cultured cortical neurons at 10 DIV were treated with vehicle (control), 2 μm DAPT, 50 μm NMDA, 100 μm d-AP5, or 2 μm MK801 for 6 h followed by immunoblotting of neuronal lysates with APP CT20, ERK2 and β-tubulin Abs. A single representative immunoblot is shown.
Figure 10.
Figure 10.
NMDA receptor stimulation inhibits AICD-Gal4-driven luciferase reporter gene activity in primary cultured cortical neurons. A, Schematic representation of a cell-based reporter gene assay for γ-secretase-mediated cleavage of APP in primary cultured cortical neurons. The assay uses a reporter APP protein consisting of human APP695 fused at its C terminus to the yeast transcription factor Gal4. After proteolytic processing of exogenously expressed APP695-Gal4 by α-secretase and/or β-secretase, cleavage by γ-secretase at the ε-site, produces an AICD-Gal4 fragment that can translocate to the nucleus in which Gal4 induces transcription of a transfected Gal4-dependent firefly luciferase reporter gene. Firefly luciferase expression is quantified by performing a Dual-Glo luciferase activity assay as detailed in Materials and Methods. B, Primary cultured cortical neurons at 8 DIV were transfected with pFR-Luc firefly luciferase reporter gene plasmid alone and in combination with plasmids encoding for APP695-Gal4 or APP695-Gal4DBD. All cells were cotransfected with phRL-TK plasmid that constitutively expresses moderate levels of Renilla luciferase. Dual-Glo luciferase activity assays were performed 24 h after transfection for quantification of firefly and Renilla luciferase expression. Firefly luciferase reporter activity was normalized using the constitutive Renilla luciferase activity. Each column is the mean ± SEM of 12 separate transfections (n = 12; **p < 0.01, pFR-Luc reporter vs pFR-Luc reporter+APP695-Gal4, one-way ANOVA with Bonferroni post test). C, Primary cultured cortical neurons at 8 DIV were transfected with pFR-Luc firefly luciferase reporter gene plasmid alone and in combination with plasmids encoding for APP695-Gal4 or Fe65. All cells were cotransfected with phRL-TK plasmid that constitutively expresses moderate levels of Renilla luciferase. Dual-Glo luciferase activity assays were performed 24 h after transfection for quantification of firefly and Renilla luciferase expression. Firefly luciferase reporter activity was normalized using the constitutive Renilla luciferase activity. Each column is the mean ± SEM of 12 separate transfections (n = 12; **p < 0.01, pFR-Luc reporter+APP695-Gal4 vs pFR-Luc reporter+APP695-Gal4+Fe65, one-way ANOVA with Bonferroni post test). D, Primary cultured cortical neurons at 8 DIV were treated with vehicle (control), 10 μm DAPT, 50 μm TAPI-1, 10 μm C3, or 20 μm Boc-d-FMK for 30 min before cotransfection with pFR-Luc firefly luciferase reporter gene, APP695-Gal4 and phRL-TK plasmids. Inhibitors were present throughout the course of the experiment. Dual-Glo luciferase activity assays were performed 24 h after transfection for quantification of firefly and Renilla luciferase expression. Firefly luciferase reporter activity was normalized using the constitutive Renilla luciferase activity. Inhibitor treatments did not alter the low level basal luciferase reporter activity arising from transfection of neurons with pFR-Luc reporter gene plasmid alone (data not shown). Each column is the mean ± SEM of 12 separate transfections (n = 12; **p < 0.01, control vs DAPT, control vs TAPI-1 control vs C3, one-way ANOVA with Bonferroni post test). E, Primary cultured cortical neurons at 8 DIV were cotransfected with pFR-Luc firefly luciferase reporter gene, APP695-Gal4, and phRL-TK plasmids. To determine whether NMDA receptor activity altered firefly luciferase reporter gene transcription over a 6 h time period, firefly and Renilla luciferase activity measurements were made in a subset of neurons 24 h after transfection (control 0 h), and at the same time, neurons were treated with vehicle (control) or 50 μm NMDA, and left for an additional 6 h followed by firefly and Renilla luciferase activity measurements. Firefly luciferase reporter activity was normalized using the constitutive Renilla luciferase activity. This experimental protocol is made possible because over the time course of the experiment, luciferase expression is cumulative and stable. Each column is the mean ± SEM of 56 separate transfections (n = 56; *p < 0.05, control vs NMDA, unpaired two-tailed Student's t test). F, Primary cultured cortical neurons at 8 DIV were cotransfected with pFR-Luc firefly luciferase reporter gene, APP695-Gal4 and phRL-TK plasmids. Twenty-four hours after transfection, neurons were treated with vehicle (control) or 2 μm MK801 for 6 h, followed by quantification of firefly and Renilla luciferase expression by performing Dual-Glo luciferase activity assays. Firefly luciferase reporter activity was normalized using the constitutive Renilla luciferase activity. Each column is the mean ± SEM of 56 separate transfections (n = 56; *p < 0.05, control vs MK801, unpaired two-tailed Student's t test). G, Primary cultured cortical neurons at 8 DIV were cotransfected with pFR-Luc firefly luciferase reporter gene, APP695-Gal4 and phRL-TK plasmids. Twenty-four hours after transfection, neurons were treated with vehicle (control), 50 μm TAPI-1, 50 μm NMDA, or 50 μm NMDA in the presence of 50 μm TAPI-1 (NMDA+TAPI-1) for 6 h, followed by quantification of firefly and Renilla luciferase expression by performing Dual-Glo luciferase activity assays. Firefly luciferase reporter activity was normalized using the constitutive Renilla luciferase activity. Each column is the mean ± SEM of 36 separate transfections. H, Primary cultured cortical neurons at 8 DIV were transfected with pFR-Luc firefly luciferase reporter gene plasmid in combination with APP695-Gal4 plasmid, or APP695-Gal4 and Fe65 plasmids. All cells were cotransfected with phRL-TK plasmid. Twenty-four hours after transfection, neurons were treated with vehicle (control) or 50 μm NMDA for 6 h, followed by quantification of firefly and Renilla luciferase expression by performing Dual-Glo luciferase activity assays. Firefly luciferase reporter activity was normalized using the constitutive Renilla luciferase activity. Each column is the mean ± SEM of 12 (APPGal4) or 24 (APPGal4+Fe65) separate transfections (*p < 0.05, APPGal4, control vs NMDA, unpaired two-tailed Student's t test).

References

    1. Abbott JJ, Howlett DR, Francis PT, Williams RJ. Abeta(1–42) modulation of Akt phosphorylation via α7 nAChR and NMDA receptors. Neurobiol Aging. 2008;29:992–1001. - PubMed
    1. Back S, Haas P, Tschäpe JA, Gruebl T, Kirsch J, Müller U, Beyreuther K, Kins S. β-Amyloid precursor protein can be transported independent of any sorting signal to the axonal and dendritic compartment. J Neurosci Res. 2007;85:2580–2590. - PubMed
    1. Bliss TV, Collingridge GL. A synaptic model of memory: long-term potentiation in the hippocampus. Nature. 1993;361:31–39. - PubMed
    1. Buckner RL, Snyder AZ, Shannon BJ, LaRossa G, Sachs R, Fotenos AF, Sheline YI, Klunk WE, Mathis CA, Morris JC, Mintun MA. Molecular, structural, and functional characterization of Alzheimer's disease: evidence for a relationship between default activity, amyloid, and memory. J Neurosci. 2005;25:7709–7717. - PMC - PubMed
    1. Buxbaum JD, Gandy SE, Cicchetti P, Ehrlich ME, Czernik AJ, Fracasso RP, Ramabhadran TV, Unterbeck AJ, Greengard P. Processing of Alzheimer β/A4 amyloid precursor protein: modulation by agents that regulate protein phosphorylation. Proc Natl Acad Sci U S A. 1990;87:6003–6006. - PMC - PubMed

Publication types

MeSH terms

Substances

LinkOut - more resources