. 2009 Apr 28;106(17):7143-8.
doi: 10.1073/pnas.0812768106. Epub 2009 Apr 8.

Experimentally observed phenomena on cardiac energetics in heart failure emerge from simulations of cardiac metabolism

Affiliations

Experimentally observed phenomena on cardiac energetics in heart failure emerge from simulations of cardiac metabolism

Fan Wu et al. Proc Natl Acad Sci U S A. .

Abstract

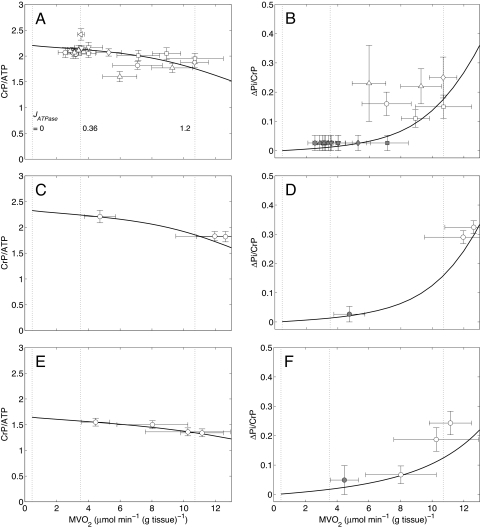
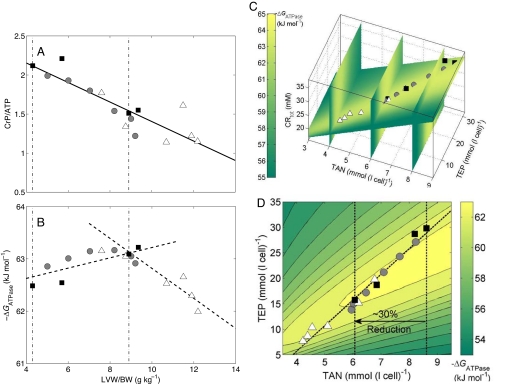
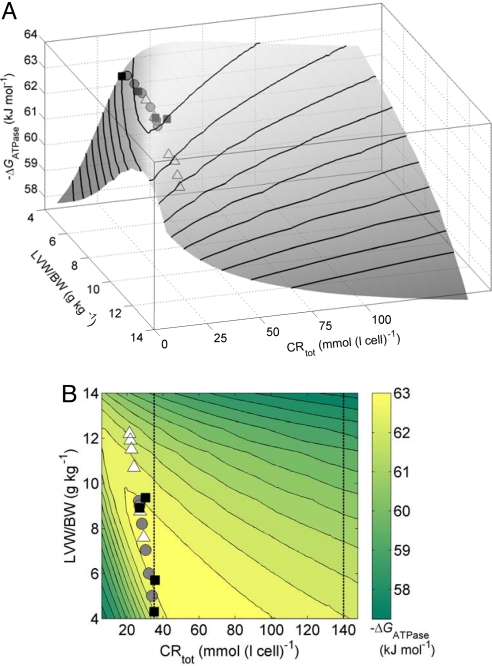
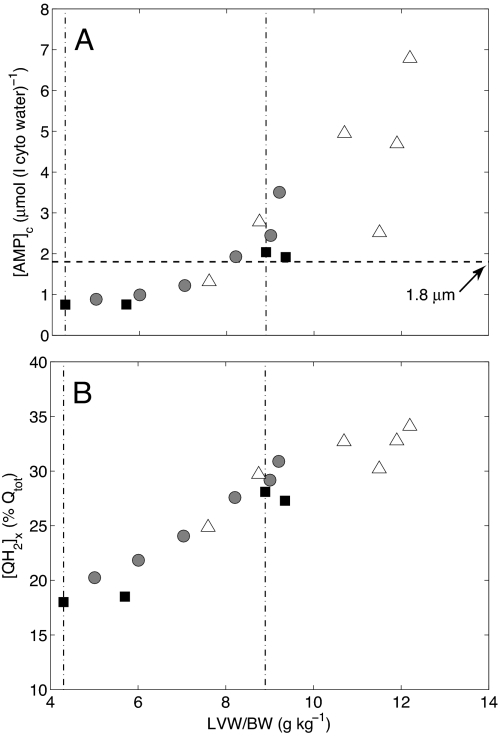
The failing heart is hypothesized to suffer from energy supply inadequate for supporting normal cardiac function. We analyzed data from a canine left ventricular hypertrophy model to determine how the energy state evolves because of changes in key metabolic pools. Our findings--confirmed by in vivo (31)P-magnetic resonance spectroscopy--indicate that the transition between the clinically observed early compensatory phase and heart failure and the critical point at which the transition occurs are emergent properties of cardiac energy metabolism. Specifically, analysis reveals a phenomenon in which low and moderate reductions in metabolite pools have no major negative impact on oxidative capacity, whereas reductions beyond a critical tipping point lead to a severely compromised energy state. The transition point corresponds to reductions in the total adenine nucleotide pool (TAN) of approximately 30%, corresponding to the reduction observed in humans in heart failure [Ingwall JS, Weiss RG (2004) Is the failing heart energy starved? On using chemical energy to support cardiac function. Circ Res 95(2):135-145]. At given values of TAN and the total exchangeable phosphate pool during hypertrophic remodeling, the creatine pool attains a value that is associated with optimal ATP hydrolysis potential. Thus, both increases and decreases to the creatine pool are predicted to result in diminished energetic state unless accompanied by appropriate simultaneous changes in the other pools.


Conflict of interest statement

The authors declare no conflict of interest.

Figures

Fig. 1.
Fig. 1.
Steady-state energetics phosphate metabolites as functions of myocardial oxygen consumption in normal and LVH hearts. Simulations are plotted as solid curves in A and B for the normal heart, C and D for the early-stage LVH heart, and E and F for the moderate LVH heart. Steady-state CrP/ATP level is plotted as a function of oxygen consumption rate, MVO2, and compared with experimental data from the normal (A), early-stage LVH (C), and moderate LVH (E) canine heart in vivo. Steady-state ΔPi/CrP plotted as a function of MVO2 and compared with experimental data from the normal (B), early-stage LVH (D), and moderate LVH (F) canine heart in vivo. For model predictions, MVO2 is varied by varying the rate of ATP hydrolysis, JATPase, in the cytoplasm. The model for the normal control case (A and B) is described in Wu et al. (2). Experimental data shown in A and B are obtained from the following sources: open circles, Zhang et al. (21) (dobutamine + dopamine); open left-facing triangles, Zhang et al. (22); open diamonds, Gong et al. (16) (dobutamine + dopamine); open triangles, Ochiai et al. (23) (dobutamine + dopamine); open inverted triangles, Gong et al. (24); squares, Bache et al. (6) (dobutamine, dobutamine + dopamine). The experimental data for the early-stage and moderate LVH hearts are plotted as open circles and obtained from refs. and , respectively. Here protocols used to elevate work load from baseline are indicated in parentheses. The values of JATPase corresponding to baseline and maximal MVO2, 0.36 and 1.2 mmol s−1 (l cell)−1, respectively, are indicated in A. Error bars indicate standard error.
Fig. 2.
Fig. 2.
Cardiac energetics during evolution of LVH. (A) Measured CrP/ATP is plotted as against LVW/BW ratio. The solid squares denote mean data measured from multiple hearts: from left to right, sources are Wu et al. (2), Bache et al. (7) (early-stage LVH), and Zhang et al. (8) and Bache et al. (6) (moderate LVH). Experimental data from individual hearts [Zhang et al. (8)] are represented as shadowed circles (with left ventricle diastolic pressure <15 mmHg) and open triangles (with left ventricle diastolic pressure >15 mmHg). The solid line is used to illustrate the linear relationship between CrP/ATP and the LVH severity (LVW/BW). The left vertical dot-dash line represents the control heart, and the right vertical dot-dash line represents the critical point where the sharp transition of energetic state takes place. (B) The model-predicted ΔGATPase at the maximal MVO2 is plotted for the data points with symbols in A. The dashed lines represent the linear fit of model prediction in the 2 distinct phases of remodeling. (C) The model-predicted profiles of ΔGATPase at the maximal MVO2 are visualized in a 3-dimensional space of CRtot, TEP, and TAN. The model predictions in B are plotted as the same symbols in C. (D) The model-predicted profiles of ΔGATPase at the maximal MVO2 are shown on a 2-dimensional plane defined by a linear relationship between CRtot and other pools. For each point on the surface, CRtot is assumed to be proportional to LVH severity and thus TAN. The dashed line represents the evolution path to heart failure.
Fig. 3.
Fig. 3.
Effects of CRtot on the cardiac energetic state in LVH. Model-predicted ATP hydrolysis potential ΔGATPase at maximal MVO2 is plotted as a function of CRtot and LVW/BW. For each value of LVW/BW, the TEP and TAN pools are fixed at values determined for the analysis illustrated in Fig. 2. Data points for LVH canine heart are plotted using the symbols defined in the legend of Fig. 2. The same results are illustrated as a surface projection (A) and a contour plot (B). The vertical lines in B indicate the normal baseline CRtot and a 4-fold increase over normal.
Fig. 4.
Fig. 4.
Changes of cytosolic AMP concentration ([AMP]c) and faction of mitochondrial ubiquinol during evolution to heart failure. (A) [AMP]c is plotted against LVH severity (LVW/BW). The symbols and 2 dot-dash vertical lines are defined as in Fig. 2 A and B. The horizontal dashed line represents the apparent AMP concentration at half-maximal activation of cardiac AMP-activated protein kinase (17). (B) The predicted reduced faction of mitochondrial ubiquinol ([QH2]x/Qtot) is plotted vs. LVW/BW.

References

    1. Balaban RS. Regulation of oxidative phosphorylation in the mammalian cell. Am J Physiol. 1990;258(3 Pt 1):C377–C389. - PubMed
    1. Wu F, Zhang EY, Zhang J, Bache RJ, Beard DA. Phosphate metabolite concentrations and ATP hydrolysis potential in normal and ischaemic hearts. J Physiol. 2008;586(Pt 17):4193–4208. - PMC - PubMed
    1. Ingwall JS, Weiss RG. Is the failing heart energy starved? On using chemical energy to support cardiac function. Circ Res. 2004;95:135–145. - PubMed
    1. Ingwall JS. Energy metabolism in heart failure and remodelling. Cardiovasc Res. 2009;81:412–419. - PMC - PubMed
    1. Neubauer S. The failing heart—an engine out of fuel. N Engl J Med. 2007;356:1140–1151. - PubMed

Publication types