. 2009 Aug;50(8):3721-8.
doi: 10.1167/iovs.08-3245. Epub 2009 Apr 8.

Quasilinear viscoelastic behavior of bovine extraocular muscle tissue

Affiliations

Quasilinear viscoelastic behavior of bovine extraocular muscle tissue

Lawrence Yoo et al. Invest Ophthalmol Vis Sci. 2009 Aug.

Abstract

Purpose: Until now, there has been no comprehensive mathematical model of the nonlinear viscoelastic stress-strain behavior of extraocular muscles (EOMs). The present study describes, with the use of a quasilinear viscoelastic (QLV) model, the nonlinear, history-dependent viscoelastic properties and elastic stress-strain relationship of EOMs.

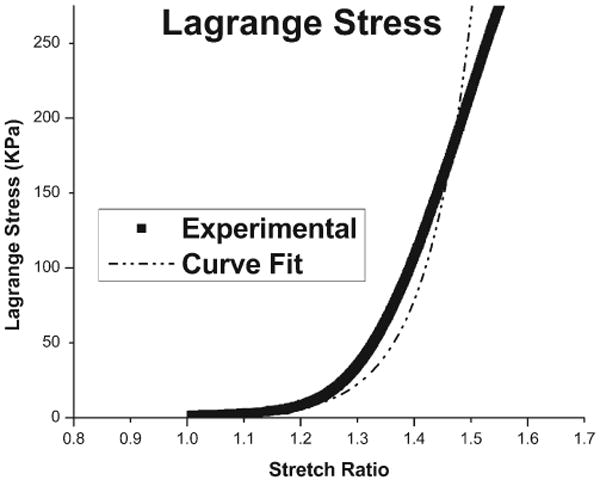
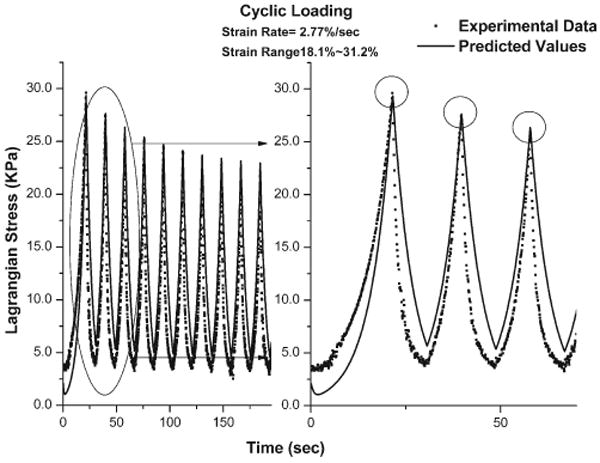
Methods: Six oculorotary EOMs were obtained fresh from a local abattoir. Longitudinally oriented specimens were taken from different regions of the EOMs and subjected to uniaxial tensile, relaxation, and cyclic loading testing with the use of an automated load cell under temperature and humidity control. Twelve samples were subjected to uniaxial tensile loading with 1.7%/s strain rate until failure. Sixteen specimens were subjected to relaxation studies over 1500 seconds. Cyclic loading was performed to validate predictions of the QLV model characterized from uniaxial tensile loading and relaxation data.

Results: Uniform and highly repeatable stress-strain behavior was observed for 12 specimens extracted from various regions of all EOMs. Results from 16 different relaxation trials illustrated that most stress relaxation occurred during the first 30 to 60 seconds for 30% extension. Elastic and reduced relaxation functions were fit to the data, from which a QLV model was assembled and compared with cyclic loading data. Predictions of the QLV model agreed with observed peak cyclic loading stress values to within 8% for all specimens and conditions.

Conclusions: Close agreement between the QLV model and the relaxation and cyclic loading data validates model quantification of EOM mechanical properties and will permit the development of accurate overall models of mechanics of ocular motility and strabismus.


Conflict of interest statement

Disclosure: L. Yoo, Manning's Beef, LLC (F); H. Kim, Manning's Beef, LLC (F); V. Gupta, Manning's Beef, LLC (F); J.L. Demer, Manning's Beef, LLC (F)

Figures

Figure 1
Figure 1
Fresh bovine EOMs immediately after extraction, oriented with origin (right) and scleral insertion (left). Scale markings are spaced at 12.5 mm. (A) Lateral rectus muscle. (B) Medial rectus muscle. (C) Inferior rectus. (D) Superior rectus. (E) Inferior oblique muscle. (F) Superior oblique muscle.
Figure 2
Figure 2
Cyclic force response of an EOM specimen demonstrates the effect of preconditioning. The specimen was maintained in square prism configuration and stretched longitudinally between 2.5% and 10% of initial length.
Figure 3
Figure 3
EOM specimens under tensile loading to failure. Dotted line: average of 12 trials (two from each EOM type) with preconditioning. Solid line: average of three trials (three LR specimens) without preconditioning.
Figure 4
Figure 4
Lagrangian stress plotted against stretch ratio for each of the six EOMs. Values are averages for two specimens of each EOM. This method, which normalizes for differing EOM thickness, illustrates similar constitutive behavior for each of the six EOMs.
Figure 5
Figure 5
Uniaxial tensile test data for 12 EOM specimens (two from each type of EOM). Error bars indicate average range of maximum and minimum values, +14.2% and −13.6%. A-B, linear region; C, point of maximum load above which specimens failed.
Figure 6
Figure 6
Uniaxial tensile test data curve fitting to the data in Figure 5. Because maximum physiological deformation was less than 40%, curve fitting was performed only on the 0% to −40% range using nonlinear least squares.
Figure 7
Figure 7
Relaxation testing. (A) Mean data plotted by individual EOM type for two LR, three MR, three IR, two SR, three IO, and three SO specimens. Because the behavior of all six EOM types was similar, data for all 16 specimens were pooled in (B), where the error bars indicate the average range (±11.4% of the mean).
Figure 8
Figure 8
Average relaxation data for EOM 16 specimens and reduced relaxation function curve fitting by the nonlinear least squares method. The panel at right is an expanded view of the early data outlined by the oval at left.
Figure 9
Figure 9
Cyclic loading experimental data and QLV model predictions for an LR specimen subjected to 10 cycles of loading and unloading at 3.14%/s for strain (range, 4.1%–28.9%). Maximum stress value for each cycle agrees well with model prediction. The average difference in maximum stress averaged 0.50 KPa over 10 cycles, whereas the difference in minimum stress averaged 0.69 KPa. The graph at right expands the initial 100-second data enclosed in the oval at left.
Figure 10
Figure 10
Cyclic loading experimental data and QLV model predictions for an SR specimen subjected to 10 cycles of loading and unloading at 1.42%/s, for strain range 21.1% to 34.6%. Maximum stress value for each cycle agreed well with model prediction. The average difference in maximum stress averaged 0.41 KPa over 10 cycles, whereas the difference in minimum stress averaged 2.98 KPa. The graph at right expands the initial 100-second data enclosed in the oval at left.
Figure 11
Figure 11
Cyclic loading experimental data and QLV model predictions for an LR specimen subjected to 10 cycles of loading and unloading at 2.77%/s, for strain range of 18.1% to 31.3%. Maximum stress value for each cycle agrees well with model prediction. The average difference in maximum stress averaged 1.27 KPa over 10 cycles, whereas the difference in minimum stress averaged 1.74 KPa. The graph at right expands the initial 100-second data enclosed in the oval at left.

References

    1. Robinson DA, O'Meara DM, Scott AB, Collins CC. Mechanical components of human eye movement. J Appl Physiol. 1969;26:548–553. - PubMed
    1. Collins CC, Carlson MR, Scott AB, Jampolsky A. Extraocular muscle forces in normal human subjects. Invest Ophthalmol Vis Sci. 1981;20:652–664. - PubMed
    1. Simonsz HJ. Force-length recording of eye muscles during local anesthesia surgery in 32 strabismus patients. Strabismus. 1994;2:197–218. - PubMed
    1. Shall MS, Dimitrova DM, Goldberg SJ. Extraocular motor unit and whole-muscle contractile properties in the squirrel monkey. Exp Brain Res. 2003;151:338–345. - PubMed
    1. Goldberg SJ, Meredith MA, Shall MS. Extraocular motor unit and whole-muscle responses in the lateral rectus muscle of the squirrel monkey. J Neurosci. 1998;18:10629–10639. - PMC - PubMed

Publication types