. 2009;4(4):e5145.
doi: 10.1371/journal.pone.0005145. Epub 2009 Apr 9.

Regulation of p110delta PI 3-kinase gene expression

Affiliations

Regulation of p110delta PI 3-kinase gene expression

Klaartje Kok et al. PLoS One. 2009.

Abstract

Background: Despite an intense interest in the biological functions of the phosphoinositide 3-kinase (PI3K) signalling enzymes, little is known about the regulation of PI3K gene expression. This also applies to the leukocyte-enriched p110delta catalytic subunit of PI3K, an enzyme that has attracted widespread interest because of its role in immunity and allergy.

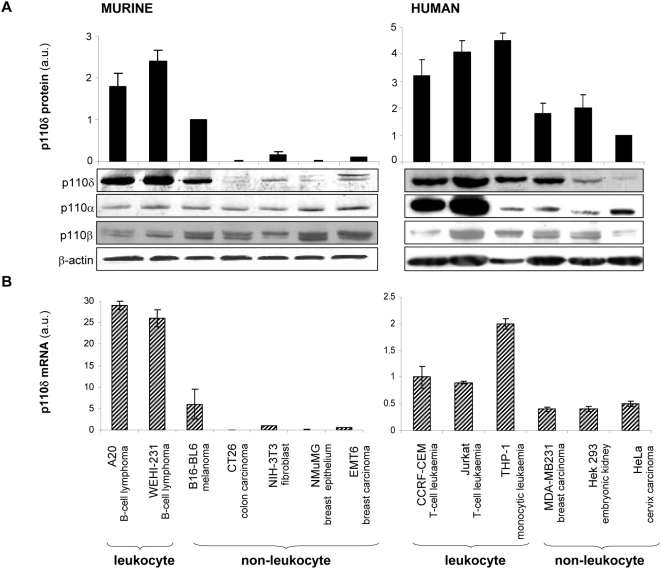
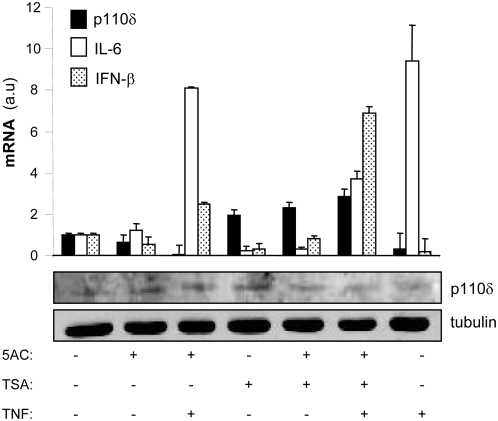
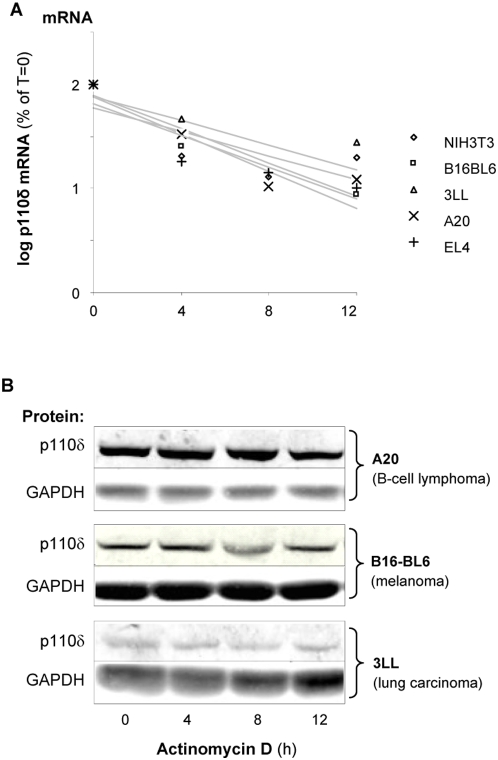
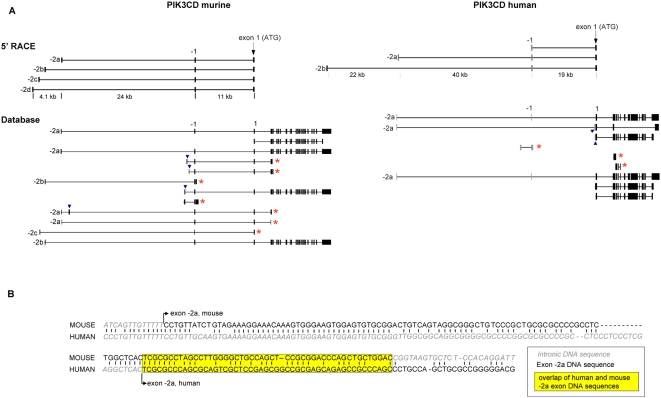
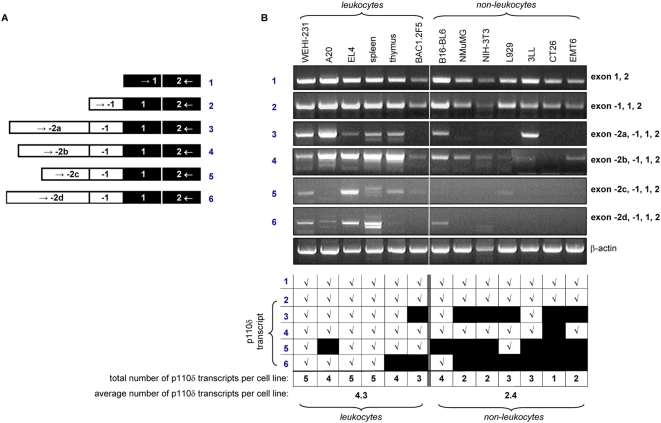
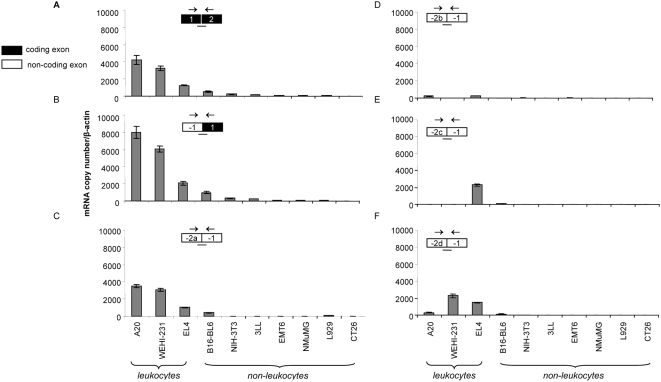
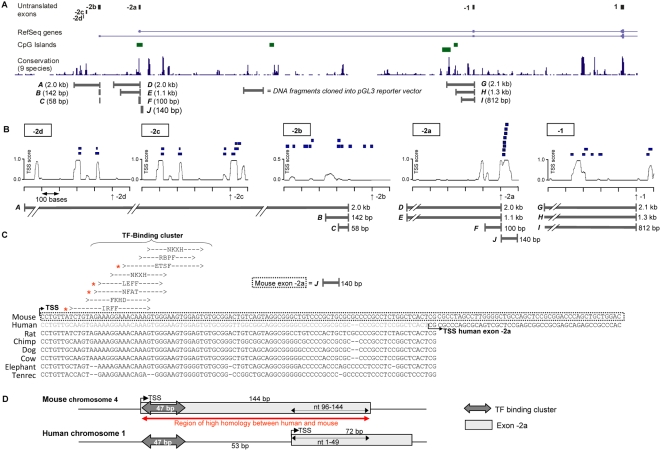
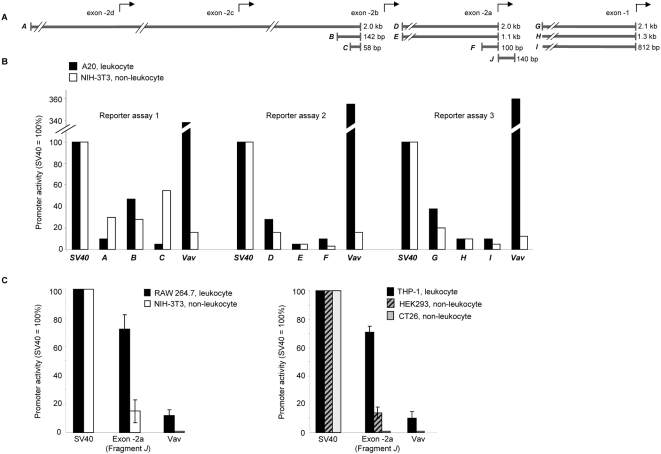
Principal findings: We show that p110delta expression is mainly regulated at the transcriptional level. In fibroblasts, lymphocytes and myeloid cells, p110delta gene transcription appears to be constitutive and not subject to acute stimulation. 5'RACE experiments revealed that p110delta mRNA transcripts contain distinct upstream untranslated exons (named exon -1, -2a, -2b, -2c and -2d), which are located up to 81 kb upstream of the translational start codon in exon 1. The levels of all the different p110delta transcripts are higher in leukocytes compared to non-leukocytes, with the p110delta transcript containing exon -2a most abundantly expressed. We have identified a highly conserved transcription factor (TF) binding cluster in the p110delta gene which has enhanced promoter activity in leukocytes compared to non-leukocytes. In human, this TF cluster is located immediately upstream of exon -2a whilst in mouse, it is located within exon -2a.

Conclusion: This study identifies a conserved PIK3CD promoter region that may account for the predominant leukocyte expression of p110delta.


Figures

Figure 1
Figure 1. Correlation between p110δ protein and mRNA expression levels in murine and human cell lines.
(A) Total cell lysates from the indicated cell lines were immunoblotted with antibodies to the distinct p110 isoforms or β-actin. One representative immunoblot of three independent experiments is shown. The bars represent quantification of the relative amounts of p110δ protein in mouse and human cell lines, as determined in 3 independent experiments (for each cell line, the ratio of the OD of the p110δ immunoblot signal was determined, relative to that of β-actin in this cell line. This value was then expressed relative to the p110δ/β-actin ratio found in B16-BL6 (for the mouse lines) or HeLa (for the human lines). Values are averages of three independent experiments. (B) Quantification of p110δ mRNA levels by real time RT-PCR using primers in the p110δ coding region. Signals are normalised to β-actin mRNA in each cell line. Data shown are the averages of three independent experiments.
Figure 2
Figure 2. DNA methylation and histone acetylation do not alter p110δ expression in mouse L929 fibroblasts.
(Top panel) L929 cells were treated with 5′-azacytidine (5AC,;5 µM) for 72 h and/or trichostatin A (TSA; 100 nM) for 6 h, with or without 6 h co-treatment with TNF (100 IU/ml)). mRNA levels of p110δ, IL-6 and IFN-β were quantified by real time RT-PCR. Samples were normalised for GAPDH and are relative to p110δ mRNA amounts in the unstimulated samples (set as 1). Shown is the average of three independent experiments). (Lower panel) Representative immunoblot (of three) of p110δ protein.
Figure 3
Figure 3. Equal p110δ mRNA stability in leukocytes and non-leukocytes.
The indicated cell lines were treated with Actinomycin D (4 µg/ml), an inhibitor of de novo RNA synthesis, for the indicated time points followed by quantification of either p110δ mRNA (A) or p110δ protein (B). p110δ mRNA was quantified by real time RT-PCR, using normalisation for 18S RNA. p110δ mRNA levels are presented in a semi-log plot.
Figure 4
Figure 4. PIK3CD transcripts, assessed by 5′RACE and database analysis.
(A) Top panel, Schematic representation of the different p110δ mRNA transcripts in their genomic context as found by 5′RACE in murine and human cell lines. Bottom panel, the different p110δ transcripts as found in the Ensembl database (release 52, 9 December 2008) for both species. Arrowheads indicate -2 exons present in the database which we have not found by 5′RACE. Asterisks indicate short PIK3CD transcripts (which do not encode full length p110δ protein) found in the Ensembl database. (B) Region of homology between mouse and human exon -2a. Exons 1 which contain the transcription start sites are indicated with a vertical arrow.
Figure 5
Figure 5. PIK3CD transcripts in murine cell lines and tissues, as assessed by RT-PCR
(A) Schematic representation of PCR primers used to detect distinct murine PIK3CD transcripts. In each case, a reverse primer in exon 2 and a forward primer in exon 1, -1, -2a, -2b, -2c or -2d, was used. (B) Agarose gel analysis of PCR products generated by RT-PCR (40 cycles) using primers for the different p110δ mRNA transcripts in panel of murine cell lines and tissues, with the observations summarized underneath.
Figure 6
Figure 6. PIK3CD transcripts in murine cell lines, as determined by real time PCR.
Absolute quantification of the different p110δ transcripts in a panel of murine cell lines by real time RT-PCR (3 experiments) using primer mixes containing a forward primer in the first exon of each transcript, a reverse primer in the subsequent exon and a probe overlaying the exon/exon boundary. Copy numbers were calculated using a standard curve with the different transcripts cloned into a plasmid, and used as a control template for PCR. Samples were normalized to the levels of β-actin mRNA. The different panels represent amplification of the boundaries of (A) exon 1/exon 2; (B) exon -1/exon 1; (C) exon -2a/exon -1 (D) exon -2b/exon -1 (E) exon -2c/exon -1 (F) exon -2d/exon -1.
Figure 7
Figure 7. Bioinformatic analysis of potential promoter elements and TF binding sites in PIK3CD.
(A) Schematic representation of the murine p110δ 5′UTR. The upper panel shows the five untranslated murine p110δ exons (and exon 1) in their genomic context, with below (in descending order): the mouse RefSeq genes, CpG islands, homology with 9 species (rat, human, chimp, rhesus, dog, cow, armadillo, elephant, tenrec, plotted against the murine sequence) and the genomic fragments that were subcloned for use in gene reporter assays. (B) Locations of the conserved TF binding sites in the 600 bases (500 upstream to 100 downstream of the transcript start site) in the forward strand flanking the different 5′untranslated exons of mouse p110δ gene. The exon start sites are indicated by the vertical arrows, the TF binding sites found on the forward strand are shown as blue boxes above the TSS score graphs. Also shown is the degree of cross species (28 species) genomic conservation as calculated by the phastCons program from a minimum of 0.0 to a maximum of 1.0. The genomic DNA fragments subcloned into the PGL3 reporter vector are shown underneath. (C) Alignment and conservation of the TF binding cluster identified in mouse exon -2a with genomic sequences upstream of the translation start site of PIK3CD of 7 other species. (D) Schematic representation of TF binding cluster location in relation to exon -2 in human and mouse.
Figure 8
Figure 8. PIK3CD promoter analysis by reporter gene assays.
(A) Schematic representation of the genomic PIK3CD DNA fragments (A–I) cloned upstream of firefly luciferase in the pGL3 reporter vector. (B) Promoter activity of each of the potential promoter regions (A–I) in A20 leukocytes and NIH-3T3 fibroblasts, as determined by luciferase reporter assays. The promoter activity of each PIK3CD region and the Vav promoter are expressed as a percentage of the SV40 promoter activity after subtraction of basal luminescence. (C) Promoter activity of mouse PIK3CD exon -2a DNA in leukocytes (RAW 264.7 and THP-1) versus non-leukocyte cell lines (NIH 3T3, HEK 293, and CT26), in two independent experiments. The promoter activity of exon -2a and Vav promoter are expressed as a percentage of the SV40 promoter activity after subtraction of basal luminescence. Each transfection was carried out in triplicate with the error bars indicating the standard deviation.

References

    1. Vanhaesebroeck B, Leevers SJ, Ahmadi K, Timms J, Katso R, et al. Synthesis and function of 3-phosphorylated inositol lipids. Annu Rev Biochem. 2001;70:535–602. - PubMed
    1. Vanhaesebroeck B, Leevers SJ, Panayotou G, Waterfield MD. Phosphoinositide 3-kinases: a conserved family of signal transducers. Trends Biochem Sci. 1997;22:267–272. - PubMed
    1. Krugmann S, Hawkins PT, Pryer N, Braselmann S. Characterizing the Interactions between the Two Subunits of the p101/p110gamma Phosphoinositide 3-Kinase and Their Role in the Activation of This Enzyme by Gbeta gamma Subunits. J Biol Chem. 1999;274:17152–17158. - PubMed
    1. Stephens LR, Eguinoa A, Erdjument-Bromage H, Lui M, Cooke F, et al. The G[beta][gamma] Sensitivity of a PI3K Is Dependent upon a Tightly Associated Adaptor, p101. Cell. 1997;89:105–114. - PubMed
    1. Suire S, Coadwell J, Ferguson GJ, Davidson K, Hawkins P, et al. p84, a New G[beta][gamma]-Activated Regulatory Subunit of the Type IB Phosphoinositide 3-Kinase p110[gamma]. Current Biology. 2005;15:566–570. - PubMed

Publication types

MeSH terms

Substances