. 2009;4(4):e5139.
doi: 10.1371/journal.pone.0005139. Epub 2009 Apr 9.

CD4 and CD8 T cell responses to the M. tuberculosis Ag85B-TB10.4 promoted by adjuvanted subunit, adenovector or heterologous prime boost vaccination

Affiliations

CD4 and CD8 T cell responses to the M. tuberculosis Ag85B-TB10.4 promoted by adjuvanted subunit, adenovector or heterologous prime boost vaccination

Tara Elvang et al. PLoS One. 2009.

Abstract

Background: Although CD4 T cells are crucial for defense against M.tb, it is still not clear whether the optimal response against M.tb in fact involves both CD4 and CD8 T cells. To test this, we used a new vaccine strategy that generated a strong balanced T cell response consisting of both CD4 and CD8 T cells.

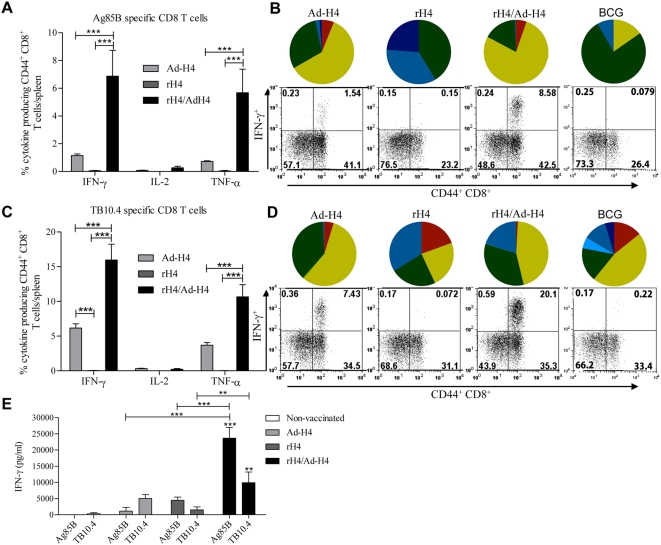
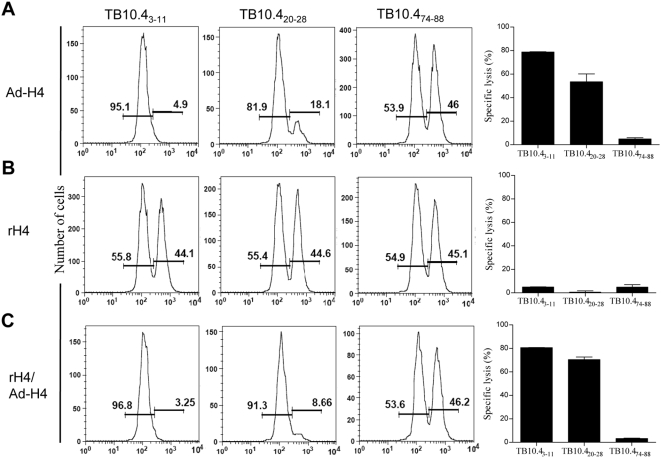
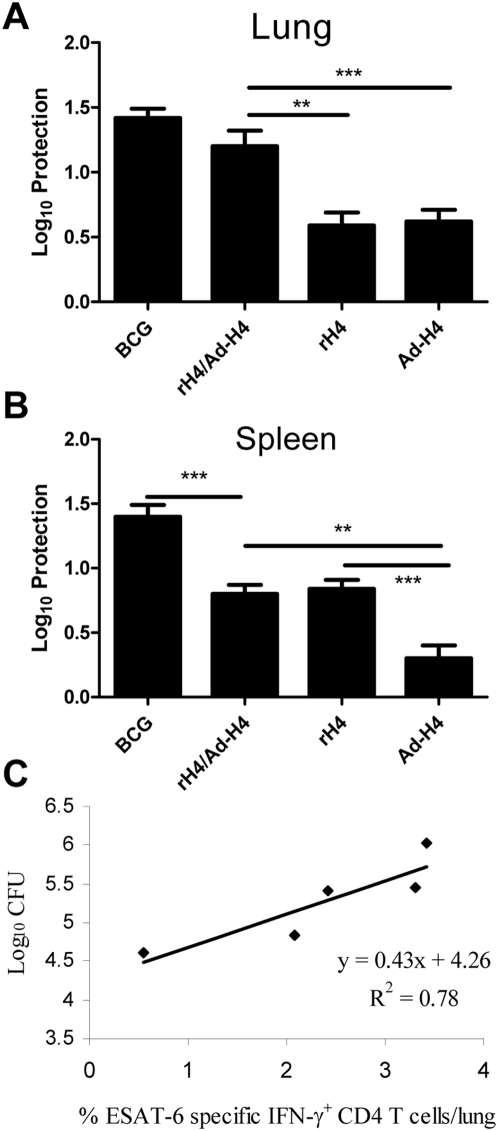
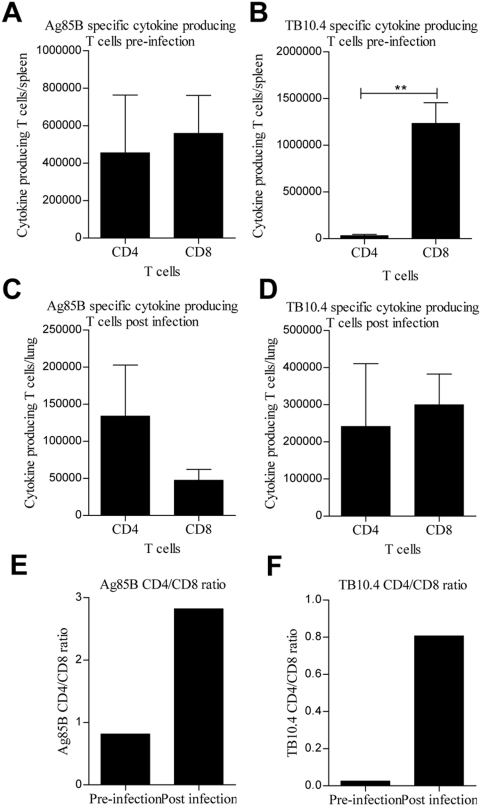
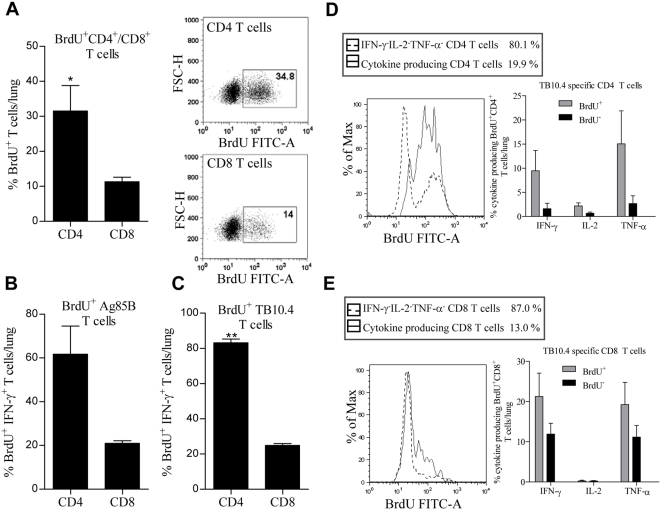
Methods and findings: To compare CD4 and CD8 responses against Ag85B-TB10.4 (H4), H4 was delivered as a subunit vaccine in cationic liposomes (CAF01), expressed in Ad5 (Ad-H4) or as a heterologous prime boost vaccination. H4/CAF01 induced primarily CD4 T cells and Ad-H4 gave predominantly a CD8 T cell response. In contrast, the heterologous prime boost combination resulted in augmentation of both the CD4 and CD8 response. The majority (>40%) of the CD4 T cells induced by the heterologous prime boost protocol were polyfunctional, and expressed IFN-gamma(+), IL-2(+), and TNF-alpha(+), whereas most of the CD8 T cells expressed IFN-gamma(+) and TNF-alpha(+) and possessed strong cytotoxic potential. The heterologous prime boost protocol also gave an increase in protective efficacy against M.tb challenge compared to H4/CAF01 and Ad-H4. Both the H4 specific CD4 and CD8 T cells were recruited to the site of infection, at the onset of infection. However, compared to CD8 T cells, CD4 T cells showed more extensive recruitment and were the main T cell subset proliferating at the site of infection.

Conclusions/significance: Heterologous prime boost based on H4, produced an additive effect on the priming of CD4 and CD8 cells and in terms of the protective capacity of the vaccine, and therefore represent an interesting new vaccine strategy against M.tb. However, CD4 and CD8 T cells respond very differently to live M.tb challenge, in a manner which supports the consensus that CD4 T cells do play the major role during the early stages of an M.tb infection.


Conflict of interest statement

Competing Interests: The authors have declared that no competing interests exist.

Figures

Figure 1
Figure 1. Cytokine frequencies and phenotypic profiles of specific CD4 T cells in Ad-H4, rH4, or rH4/Ad-H4 vaccinated mice one week after final vaccination.
CB6F1 mice were vaccinated once with Ad-H4, twice with rH4 in cationic liposomes, or once with rH4 in cationic liposomes followed two weeks later by one Ad-H4 vaccination. Mice were sacrificed one week after the final vaccination and splenocytes were stimulated with Ag85B or TB10.4 peptides prior to staining with anti-CD4, -CD44, -IFN-γ, -IL-2, and –TNF-α. (A and C) Frequencies represent IFN-γ, IL-2, or TNF-α producing CD44+CD4+ T cells out of total CD4 T cells specific for Ag85B (A) or TB10.4 (C). Background staining from cells stimulated with medium alone has been subtracted. Data represent the mean+SEM of a minimum of five mice per group with ***, p<0.001, **, p<0.01, and *, p<0.05 (2-way ANOVA with Bonferroni posttest). (B and D) IFN-γ, IL-2, and TNF-α cytokine profiles of Ag85B (B) or TB10.4 (D) specific CD4 T cells shown as triple, double, or single positive CD4 T cells. The color code for the pies is shown in (E). Dot plots representative of five mice are also shown in (B) and (D), depicting IFN-γ expressed by CD4+CD44+ cells after stimulation with Ag85B (B) or TB10.4 (D).
Figure 2
Figure 2. Cytokine frequencies and phenotypic profiles of specific CD8 T cells in Ad-H4, rH4, or rH4/Ad-H4 vaccinated mice one week after final vaccination.
CB6F1 mice were vaccinated once with Ad-H4, twice with rH4 in cationic liposomes, or once with rH4 in cationic liposomes followed two weeks later by one Ad-H4 vaccination. Mice were sacrificed one week after the final vaccination and splenocytes were stimulated with Ag85B or TB10.4 peptides prior to staining with anti-CD8, -CD44, -IFN-γ, -IL-2, and –TNF-α. (A and C) Frequencies represent IFN-γ, IL-2, or TNF-α producing CD44+CD8+ T cells out of total CD8 T cells specific for Ag85B (A) or TB10.4 (C). Background staining from cells stimulated with medium alone has been subtracted. Data represent the mean+SEM of a minimum of five mice per group with ***, p<0.001, **, p<0.01, and *, p<0.05 (2-way ANOVA with Bonferroni posttest). (B and D) IFN-γ, IL-2, and TNF-α cytokine profiles of Ag85B (B) or TB10.4 (D) specific CD8 T cells shown as triple, double, or single positive CD8 T cells. The color code for the pies is the same as shown in Fig. 1E. Dot plots, representative of five mice, are also shown in (B) and (D), depicting IFN-γ expressed by CD44+CD8+ cells after stimulation with Ag85B (B) or TB10.4 (D). (E) Cells were stimulated with Ag85B or TB10.4 in vitro for 72 hours and IFN-γ levels in supernatants were assessed by ELISA. Data represent the mean+SEM of a minimum of five mice per group with ***, p<0.001, ** and p<0.01 compared with non-vaccinated group, unless otherwise indicated (2-way ANOVA with Bonferroni posttest).
Figure 3
Figure 3. Functional characterization of the vaccine induced T cells.
The specific lysis of TB10.43-11, TB10.420-28, and TB10.470-88 loaded cells were determined in an in vivo cytotoxicity assay. Unloaded (CFSElow) and TB10.43-11, TB10.420-28, or TB10.470-88 (CFSEhigh) loaded splenocytes from naïve mice were transferred into Ad-H4 (A), rH4 (B), or rH4/Ad-H4 (C) vaccinated mice. (A–C) The amount of splenocytes killed in vivo by cytotoxic T cells specific for either of the TB10.4 target peptides was observed as a reduction in the CFSEhigh population Percent specific lysis was calculated and is shown in the far right graphs. Non-specific cytotoxicity from non-vaccinated mice has been subtracted (Non-specific killing in non-vaccinated mice of either CFSEhigh or CFSElow cells were from 5–15%).
Figure 4
Figure 4. The protective efficacy and correlation of protection with infection driven immune response in the vaccinated and challenged mice.
(A and B) Protection in vaccinated mice (expressed as Log10 CFU reduction) compared to unvaccinated and BCG vaccinated controls challenged by the aerosol route with virulent M.tb. six weeks after the final vaccination. Six weeks post-challenge, the mice were sacrificed and the bacterial burden (CFU) was measured in the lung or spleen. Data represent the mean+SEM of a minimum of five mice per group in two individual experiments with ***, p<0.001 and **, p<0.01 (2-way ANOVA with Bonferroni posttest). (C) Relation between protection (CFU) and ESAT-6 specific IFN-γ producing CD4 T cells is shown as a fitted regression line with the correlation coefficient (R2). Six weeks post challenge, the mice were sacrificed and the lung cells were stimulated with ESAT-6 overlapping peptides prior to staining with anti-CD4, -CD44, and –IFN-γ. Frequencies represent IFN-γ producing ESAT-6 specific CD44+CD4+ T cells out of total CD4 T cells. Background staining from cells stimulated with medium alone has been subtracted. Data represent the mean of +SEM of a minimum of five mice per group in two individual experiments.
Figure 5
Figure 5. Cytokine frequencies and phenotypic profiles of specific CD4 and CD8 T cells in non-vaccinated or rH4/Ad-H4 vaccinated mice two weeks after challenge.
CB6F1 mice were vaccinated once with rH4 in cationic liposomes followed two weeks later by one Ad-H4 vaccination, and challenged by the aerosol route with virulent M.tb six weeks after the final vaccination. Two weeks after challenge the mice were sacrificed and lung lymphocytes were stimulated with Ag85B or TB10.4 peptides prior to staining with anti-CD4, -CD8, -CD44, -IFN-γ, -IL-2, and –TNF-α. Frequencies represent IFN-γ, IL-2, or TNF-α producing CD44+CD4+ or CD44+CD8+ T cells specific for Ag85B (A and B) or TB10.4 (C and D). Background staining from cells stimulated with medium alone has been subtracted. Data represent the mean+SEM of four mice per group with **, p<0.01 (2-way ANOVA with Bonferroni posttest). IFN-γ, IL-2, and TNF-α cytokine profiles of Ag85B or TB10.4 specific CD4 and CD8 T cells are shown in pies as triple, double, or single positive CD4 or CD8 T cells. The color code for the pies is the same as shown in Fig. 1E.
Figure 6
Figure 6. Recruitment of Ag85B and TB10.4 CD4 and CD8 T cells to the lung.
Antigen specific CD4 and CD8 T cells in rH4/Ad-H4 vaccinated mice were measured two weeks before and after challenge. CB6F1 mice were vaccinated once with rH4 in cationic liposomes followed two weeks later by one Ad-H4 vaccination, and challenged by the aerosol route with virulent M.tb six weeks after the final vaccination. Two weeks before challenge and two weeks after challenge mice were sacrificed, and splenocytes and lung lymphocytes, respectively, were stimulated with Ag85B or TB10.4 peptides prior to staining with anti-CD4, -CD8, -CD44, -IFN-γ, -IL-2, and –TNF-α. (A–D) The number of cytokine producing T cells is a total number of triple, double, and single positive IFN-γ, TNF-α, and IL-2 producing antigen specific CD4 or CD8 T cells either per spleen pre-infection (A and B) or per lung post infection (C and D). Background staining from cells stimulated with medium alone has been subtracted. Data represent the mean+SEM of four mice per group with **, p<0.01 (2-way ANOVA with Bonferroni posttest). (E and F) The ratio between Ag85B (E) and TB10.4 (F) specific CD4 and CD8 T cells was calculated from A–D.
Figure 7
Figure 7. The proliferative capacity and frequency of the recruited Ag85B and TB10.4 specific CD4 and CD8 T cells to the lungs.
CB6F1 mice were vaccinated once with rH4 in cationic liposomes followed two weeks later by one Ad-H4 vaccination, and challenged by the aerosol route with virulent M.tb at week 10. The last three days before killing, BrdU (0.8 mg/ml) was added to the drinking water. Two weeks after challenge, mice were sacrificed and lung lymphocytes were stimulated with Ag85B or TB10.4 peptides prior to staining with anti-CD4, -CD8, -BrdU, and -IFNγ (A–C). (A) Frequencies represent the percentage of BrdU+ CD4 or CD8 T cells out of total CD4 or CD8 T cells. Data represent the mean of +SEM of four mice per group with *, p<0.05 (Unpaired t-test, two-tailed). Dot plots, representative of four mice, are also shown depicting BrdU+ CD4 or CD8 T cells. (B and C) Frequencies represent the percentage of BrdU+ CD4 or CD8 T cells out of total IFN-γ+ CD4 or CD8 T cells specific for either Ag85B (B) or TB10.4 (C). Data represent the mean+SEM of two mice per group with **, p<0.01 (Unpaired t-test, two-tailed). Background staining from cells stimulated with medium alone has been subtracted. (D and E) CB6F1 mice were vaccinated once with rH4 in cationic liposomes followed two weeks later by one Ad-H4 vaccination, and challenged by the aerosol route with virulent M.tb at week 10. The last three days before sacrificing the animals, BrdU (0.8 mg/ml) was added to the drinking water. Two weeks after challenge mice were sacrificed and lung lymphocytes were stimulated with TB10.4 peptides prior to staining with anti-CD4, -CD8, -BrdU, -IFN-γ, TNF-α, and IL-2. The BrdU histograms represent a normalized overlay of all the cytokine producing CD4 (D) and CD8 (E) T cells, (IFN-γ+IL-2+TNF-α+, IFN-γ+TNF-α+, IFN-γ+IL-2+, IFN-γ+, IL-2+TNF-α+, IL-2+, and TNF-α+) (solid line), and all the non-cytokine producing CD4 and CD8 T cells (IFN-γIL-2TNF-α) (dashed line), and the percentages shown are the percentages of cytokine producing or cytokine non-producing T cells out of total T cells. Instead of displaying counts in the FACS histogram overlays, each histogram in the overlay has been normalized to its maximum counts (“% of MAX” counts). Data represent the mean of +SEM of three mice per group. Background staining from cells stimulated with medium alone has been subtracted.

References

    1. Cooper AM, Dalton DK, Stewart TA, Griffin JP, Russell DG, et al. Disseminated tuberculosis in interferon gamma gene-disrupted mice. J Exp Med. 1993;178:2243–2247. - PMC - PubMed
    1. Dorman SE, Holland SM. Interferon-gamma and interleukin-12 pathway defects and human disease. Cytokine Growth Factor Rev. 2000;11:321–333. - PubMed
    1. Flynn JL, Chan J, Triebold KJ, Dalton DK, Stewart TA, et al. An essential role for interferon gamma in resistance to Mycobacterium tuberculosis infection. J Exp Med. 1993;178:2249–2254. - PMC - PubMed
    1. Tascon RE, Stavropoulos E, Lukacs KV, Colston MJ. Protection against Mycobacterium tuberculosis infection by CD8+ T cells requires the production of gamma interferon. Infect Immun. 1998;66:830–834. - PMC - PubMed
    1. Derrick SC, Repique C, Snoy P, Yang AL, Morris S. Immunization with a DNA vaccine cocktail protects mice lacking CD4 cells against an aerogenic infection with Mycobacterium tuberculosis. Infect Immun. 2004;72:1685–1692. - PMC - PubMed

Publication types

MeSH terms