. 2009;4(4):e5163.
doi: 10.1371/journal.pone.0005163. Epub 2009 Apr 9.

Microsaccade rate varies with subjective visibility during motion-induced blindness

Affiliations

Microsaccade rate varies with subjective visibility during motion-induced blindness

Po-Jang Hsieh et al. PLoS One. 2009.

Abstract

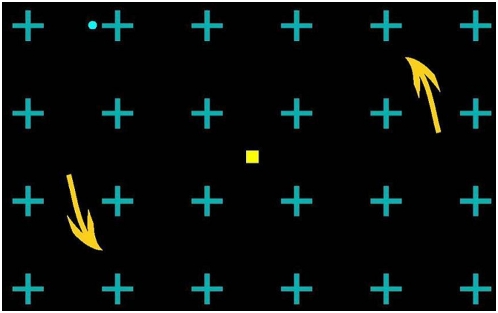
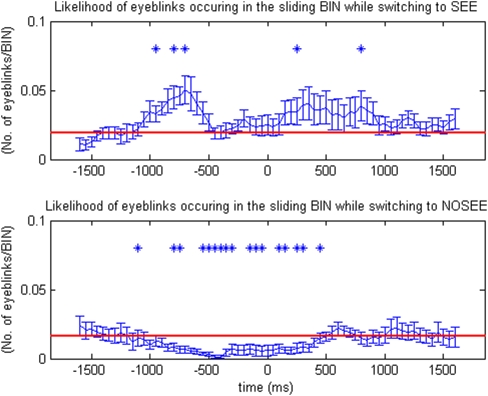
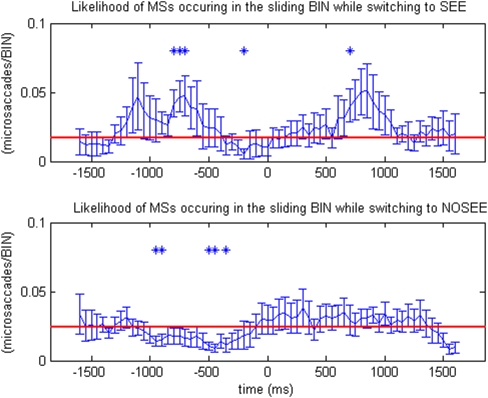
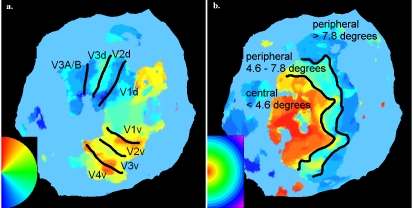
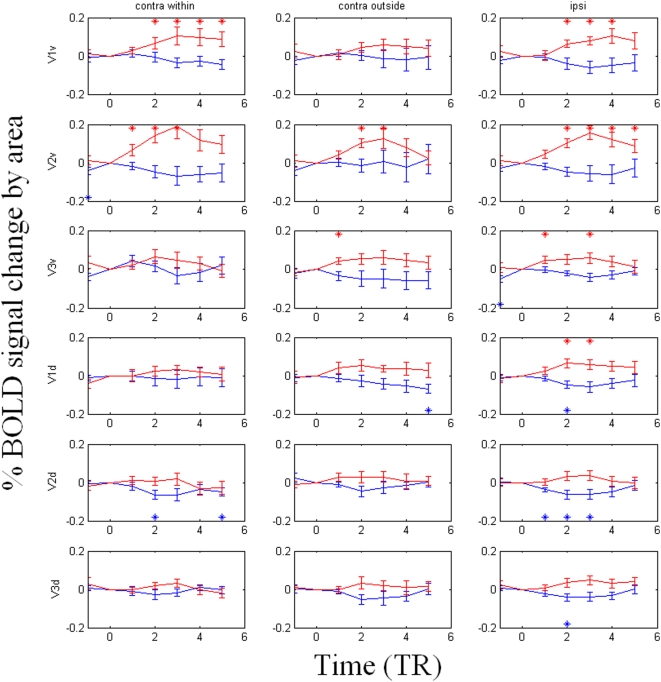
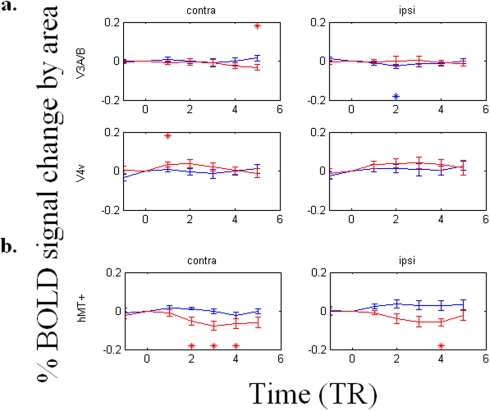
Motion-induced blindness (MIB) occurs when a dot embedded in a motion field subjectively vanishes. Here we report the first psychophysical data concerning effects of microsaccade/eyeblink rate upon perceptual switches during MIB. We find that the rate of microsaccades/eyeblink rises before and after perceptual transitions from not seeing to seeing the dot, and decreases before perceptual transitions from seeing it to not seeing it. In addition, event-related fMRI data reveal that, when a dot subjectively reappears during MIB, the blood oxygen-level dependent (BOLD) signal increases in V1v and V2v and decreases in contralateral hMT+. These BOLD signal changes observed upon perceptual state changes in MIB could be driven by the change of perceptual states and/or a confounding factor, such as the microsaccade/eyeblink rate.


Conflict of interest statement

Competing Interests: The authors have declared that no competing interests exist.

Figures

Figure 1
Figure 1. Stimuli.
The rotating background stimulus for inducing MIB. It consisted of cyan crosses on a black background rotating counterclockwise at 70°/sec, as indicated by the yellow arrows (not present in stimulus). After fixating on the central fixation spot for several seconds, the cyan dot disappears and reappears alternatively.
Figure 2
Figure 2. Rates of eyeblinks (n = 10) around the time of a perceptual switch (time 0).
The rate of eyeblinks rises before and after perceptual transitions from ‘no see’ to ‘see’, and decreases during perceptual transitions from ‘see’ to ‘no see.’ In the two-tailed simple t-test, those data points that are significantly different than the baseline (red line) are marked as * (p<0.05)
Figure 3
Figure 3. Rates of microsaccades around the time of a perceptual switch (time 0).
The rate of microsaccades rises before and after perceptual transitions from ‘no see’ to ‘see’, and decreases before perceptual transitions from ‘see’ to ‘no see.’ In the two-tailed simple t-test, those data points that are significantly different than the baseline (red line) are marked as * (p<0.05).
Figure 4
Figure 4. Retinotopy.
(a) A typical retinotopic map of the flattened left hemisphere occipital pole for one subject is shown with the approximate borders between the retinotopic areas specified in black. Retinotopic area masks were individually specified for each hemisphere of each subject. Blue here represents the lower vertical meridian, cyan/green the horizontal meridian, and red the vertical meridian. (b) A typical retinotopic map of the flattened left hemisphere occipital pole for one subject is shown with the approximate borders specified in black between the central (<4.6 visual degrees), middle (4.6–7.8 visual degrees), and peripheral (>7.8 visual degrees) areas.
Figure 5
Figure 5. The differences of BOLD timecourses (TR = 1.6 seconds) upon perceptual switches in V1v, V1d, V2v, V2d, V3v, and V3d.
The BOLD signal change averaged across voxels within subjects' ROIs and across hemispheres relative to the 16 slice volume acquisition (TR) = 0 position, corresponding to the beginning of a volume in which the subject reported a perceptual switch. The area is marked ‘contra within’ when the target was located inside the corresponding visual field, and marked ‘contra outside’ when target was located on the contralateral side to the ROI but outside the corresponding visual field. The area is marked ‘ipsi’ when the ROI was on the same side as the target that underwent MIB. The x-axis shows the time in units of TR (1.6 seconds), and the y-axis shows the percentage change of BOLD signal (%). The results show that the BOLD signal increased when the stimulus reappeared from MIB in V1v and V2v. The same result was observed when the stimulus was presented ipsilaterally to these areas. Statistics for Figures 5 and 6: N = 14; A two-tailed t-test was carried out to compare the value of TR = 0 (set to be zero) to the means of each TR individually. Those data points that are significantly different than 0 are marked as ‘*’ (p<0.05).
Figure 6
Figure 6. The differences of BOLD signal timecourses (TR = 1.6 seconds) upon perceptual switches in V3A/B, V4v, and hMT+.
(a) The BOLD signal modulates weakly in V3A/B or V4v. (b) The BOLD signal modulates with the percept in contralateral hMT+, in a manner largely opposite that of V1v and V2v. In particular, BOLD signal decreases upon subjective disappearance of the dot in hMT+, but increases in V1 and V2.

Similar articles

Cited by

References

    1. Bonneh YS, Cooperman A, Sagi D. Motion-induced blindness in normal observers. Nature. 2001;14:798–801. - PubMed
    1. Graf EW, Adams WJ, Lages M. Modulating motion-induced blindness with depth ordering and surface completion. Vision Res. 2002;42:2731–2735. - PubMed
    1. Hsu LC, Yeh SL, Kramer P. Linking motion-induced blindness to perceptual filling-in. Vision Res. 2004;44:2857–2866. - PubMed
    1. Troxler D. Über das Verschwinden gegebener Gegenstände innerhalb unsers Gesichtskreises, In: Himly K, Schmidt JA, editors. Ophthalmologisches Bibliothek. Jena: Fromman; 1804. pp. 51–53.
    1. Ramachanndran V. Blindspot. Sci Am. 1992;266:4–49.

Publication types

MeSH terms