. 2009 Jul 15;125(2):276-85.
doi: 10.1002/ijc.24388.

Induction of osteopontin expression by nicotine and cigarette smoke in the pancreas and pancreatic ductal adenocarcinoma cells

Affiliations

Induction of osteopontin expression by nicotine and cigarette smoke in the pancreas and pancreatic ductal adenocarcinoma cells

Galina Chipitsyna et al. Int J Cancer. .

Abstract

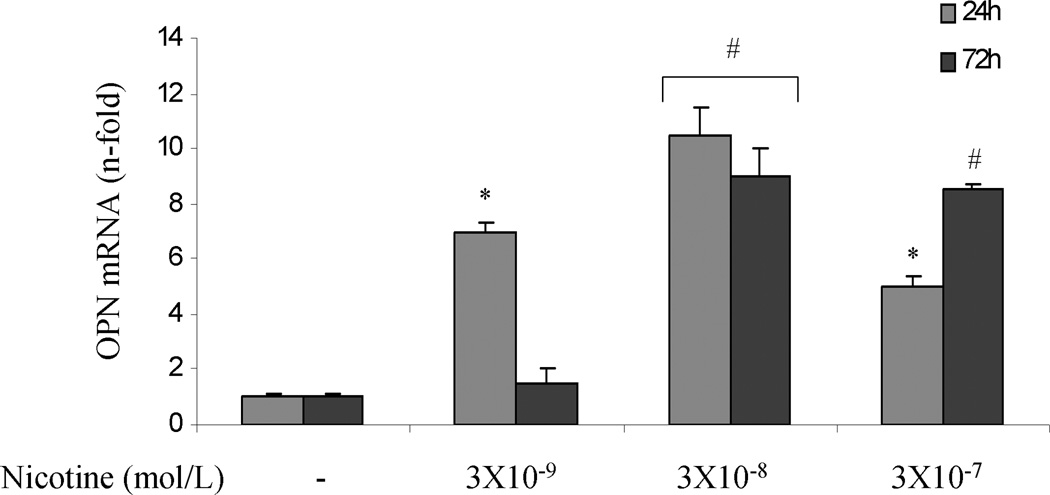
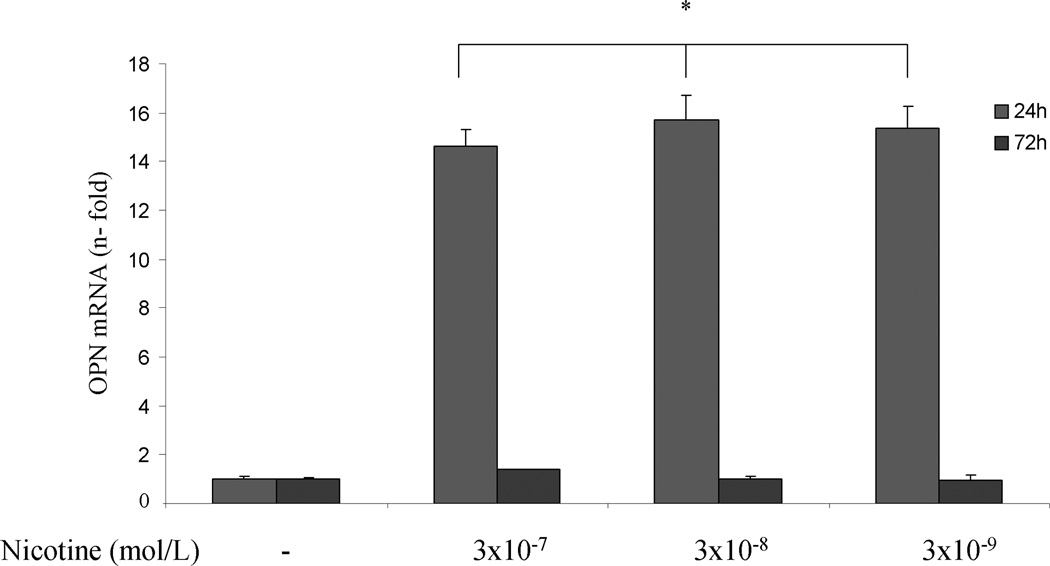
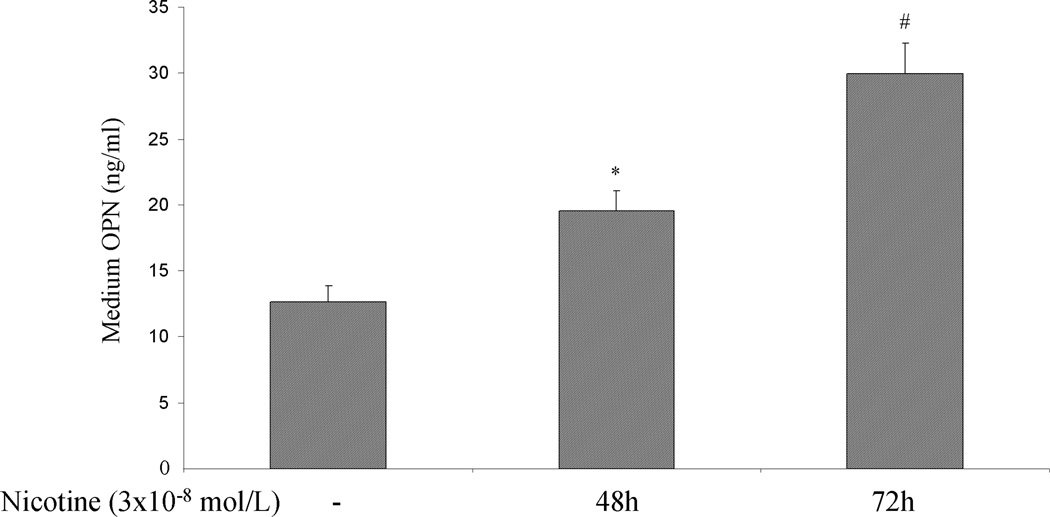
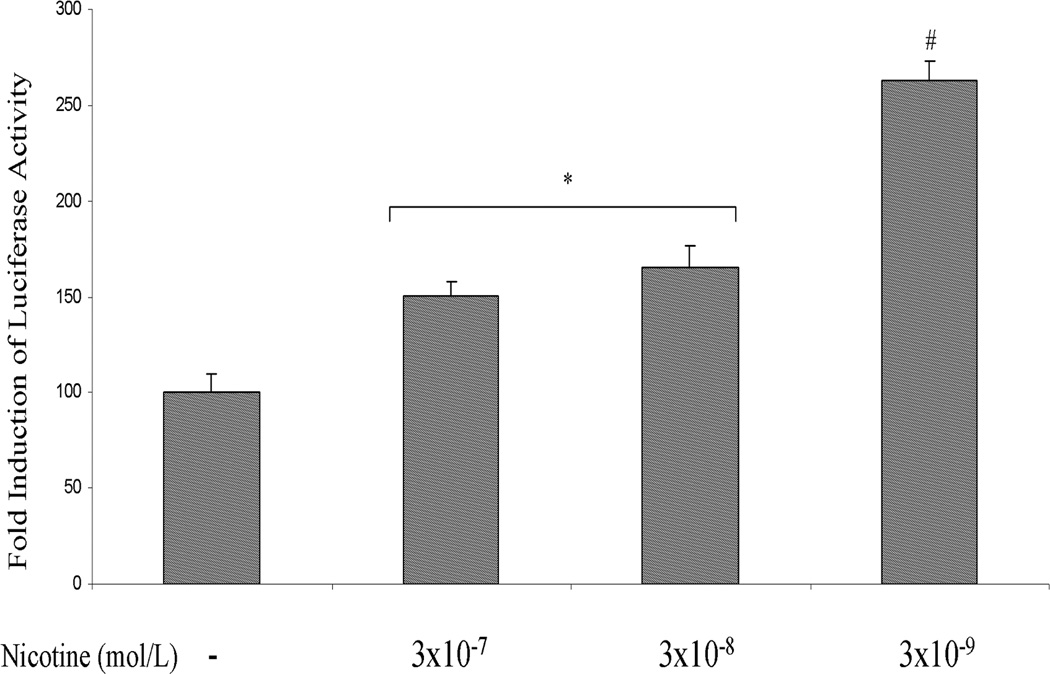
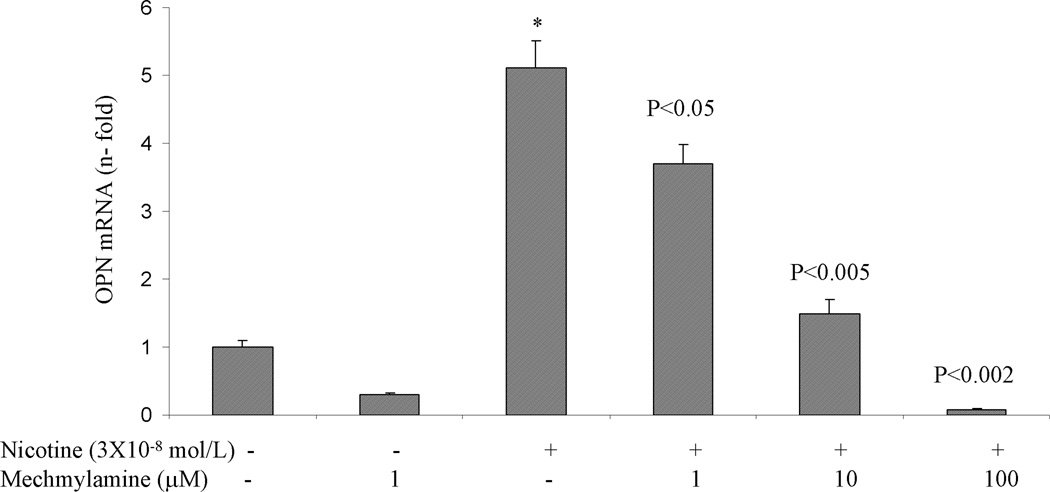
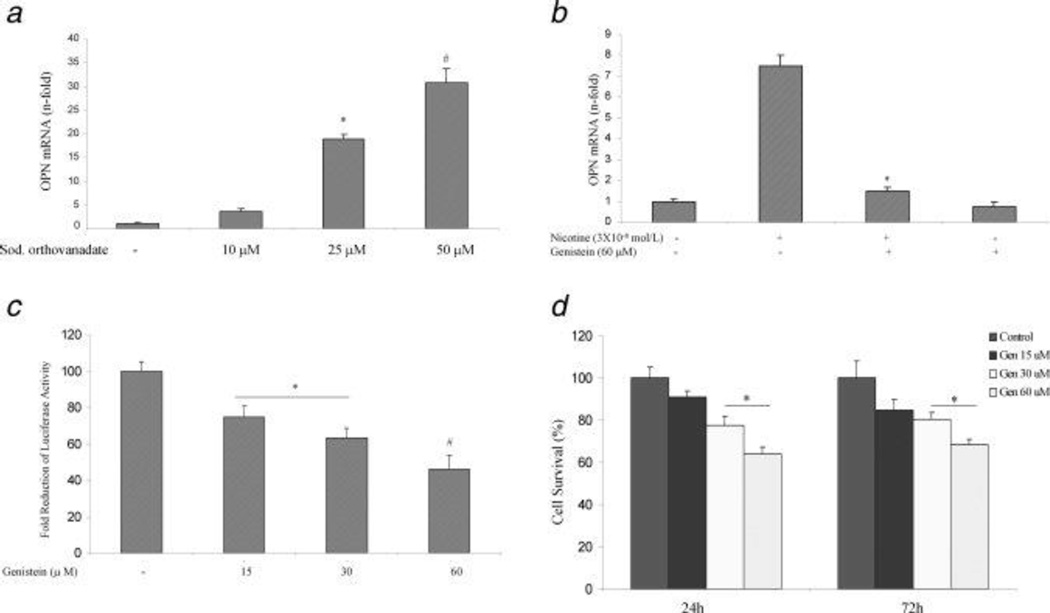
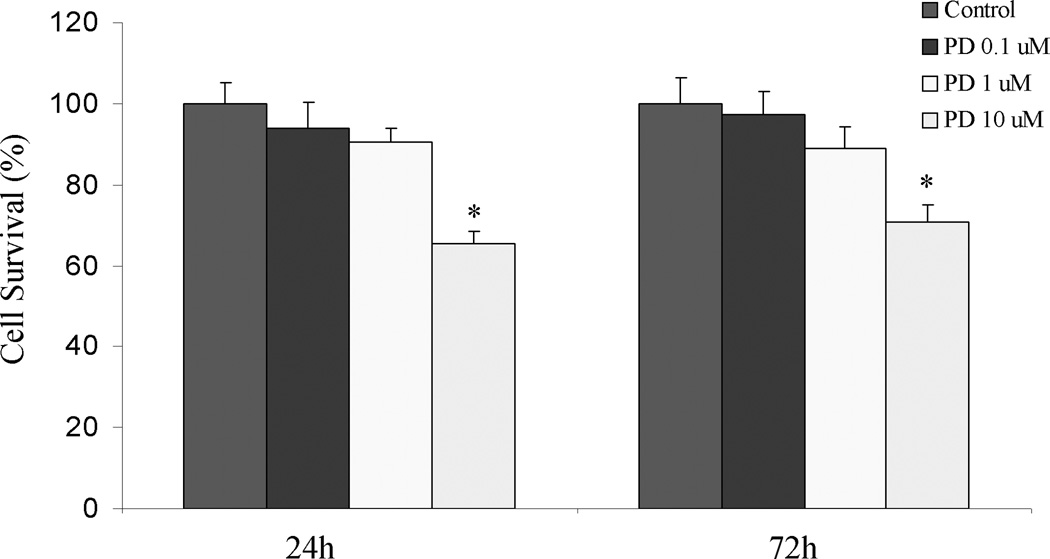
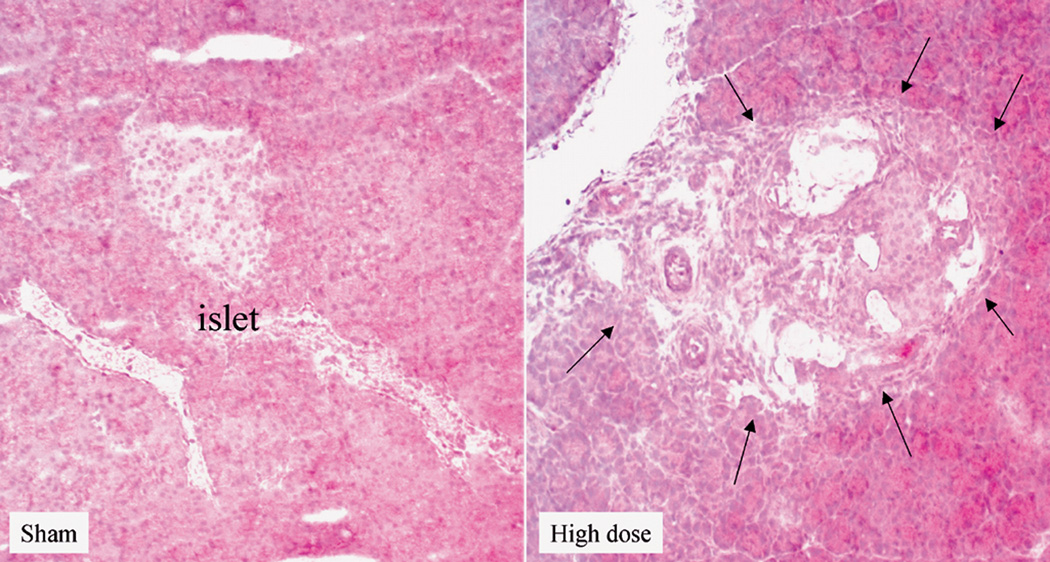
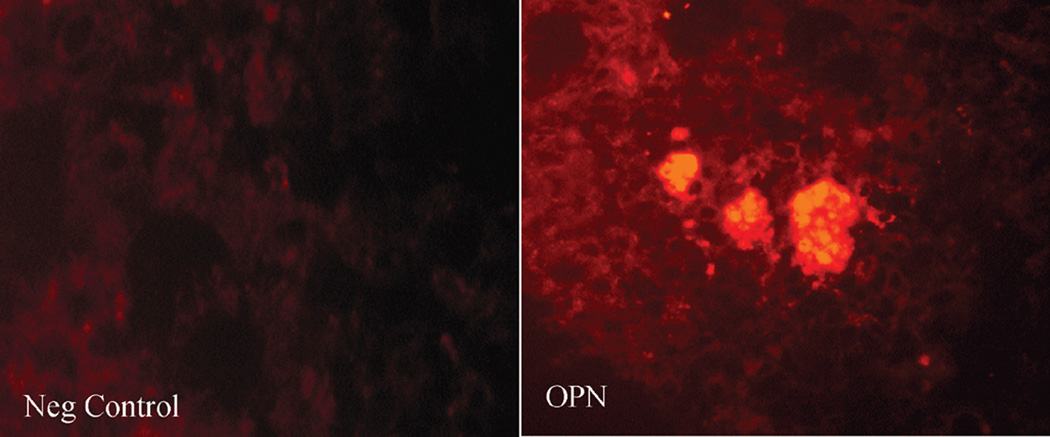
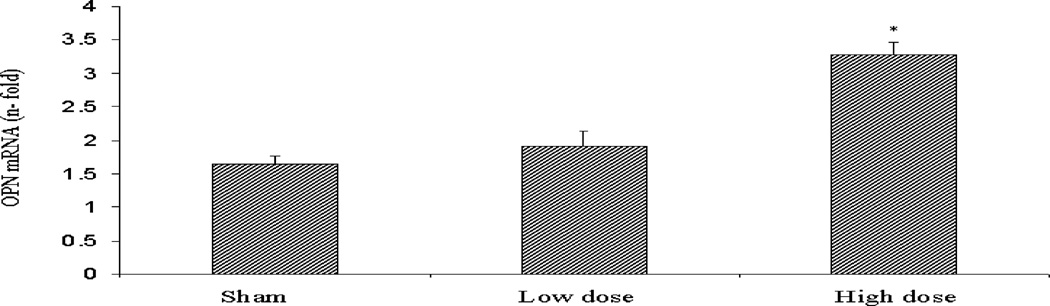
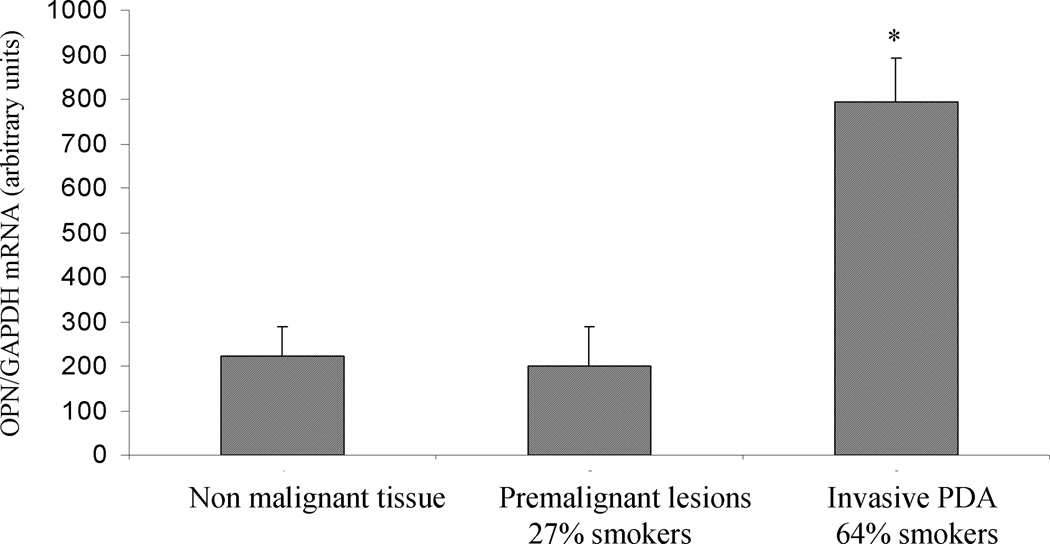
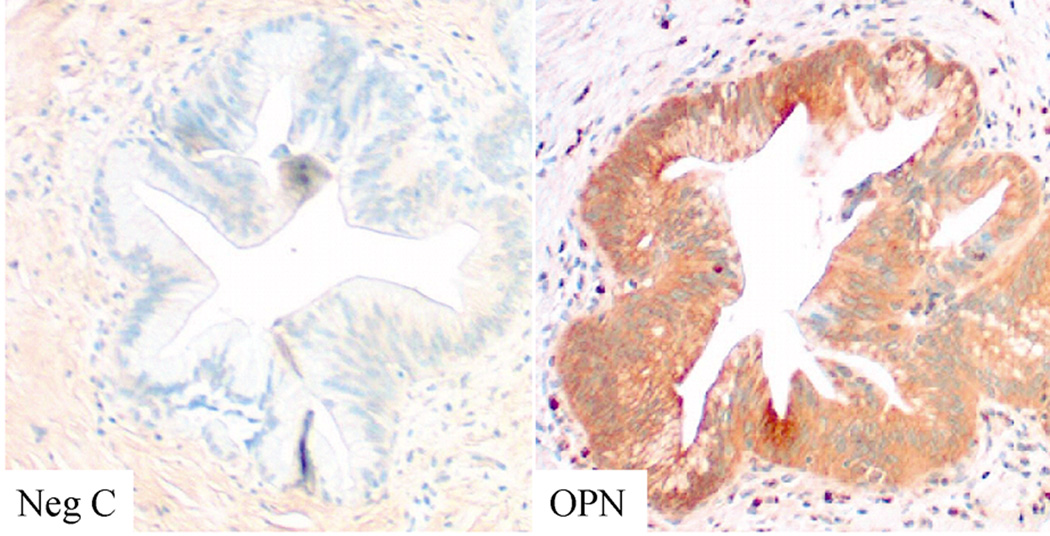
Pancreatic ductal adenocarcinoma (PDA) is a lethal disease with etiological association with cigarette smoking. Nicotine, an important component of cigarettes, exists at high concentrations in the bloodstream of smokers. Osteopontin (OPN) is a secreted phosphoprotein that confers on cancer cells a migratory phenotype and activates signaling pathways that induce cell survival, proliferation, invasion, and metastasis. Here, we investigated the potential molecular basis of nicotine's role in PDA through studying its effect on OPN. Nicotine significantly (p < 0.02) increased OPN mRNA and protein secretion in PDA cells through activation of the OPN gene promoter. The OPN mRNA induction was inhibited by the nicotinic acetylcholine receptor antagonist, mechamylamine. Further, the tyrosine kinase inhibitor genistein inhibited the nicotine-mediated induction of OPN, suggesting that mitogen activated protein kinase signaling mechanism is involved. Nicotine activated the phosphorylation of ERK1/2, but not p38 or c-Jun NH2-terminal MAP kinases. Inhibition of ERK1/2 activation reduced the nicotine-induced OPN synthesis. Rats exposed to cigarette smoke showed a dose-dependent increase in pancreatic OPN that paralleled the rise of pancreatic and plasma nicotine levels. Analysis of cancer tissue from invasive PDA patients, the majority of whom were smokers, showed the presence of significant amounts of OPN in the malignant ducts and the surrounding pancreatic acini. Our data suggest that nicotine may contribute to PDA pathogenesis through upregulation of OPN. They provide the first insight into a nicotine-initiated signal transduction pathway that regulates OPN as a possible tumorigenic mechanism in PDA.


Figures

Figure 1
Figure 1
Nicotine induces OPN accumulation in cultured PDA cells. AsPC-1 (A), Hs766T (B), and PK9 (C) cells were treated with nicotine (3×10⁻⁹ – 3×10⁻⁷ mol/L) for 24 and 72 hr. Significant induction of OPN mRNA expression is seen with the maximum induction after 24 hr at 3×10⁻⁸ mol/L of nicotine. OPN protein in culture media was measured using human-specific ELISA kit. Significant induction of OPN protein secretion is seen in AsPC-1 cells (D), HS766T (E), and PK9 (F) with a maximum at 72h. Each experiment was repeated three times for reproducibility. Values are expressed as mean ± SEM of three experiments. * p < 0.05 # p<0.005 vs. control levels, using one-way repeated ANOVA with subsequent all pairwise comparison procedure by student t-test.
Figure 1
Figure 1
Nicotine induces OPN accumulation in cultured PDA cells. AsPC-1 (A), Hs766T (B), and PK9 (C) cells were treated with nicotine (3×10⁻⁹ – 3×10⁻⁷ mol/L) for 24 and 72 hr. Significant induction of OPN mRNA expression is seen with the maximum induction after 24 hr at 3×10⁻⁸ mol/L of nicotine. OPN protein in culture media was measured using human-specific ELISA kit. Significant induction of OPN protein secretion is seen in AsPC-1 cells (D), HS766T (E), and PK9 (F) with a maximum at 72h. Each experiment was repeated three times for reproducibility. Values are expressed as mean ± SEM of three experiments. * p < 0.05 # p<0.005 vs. control levels, using one-way repeated ANOVA with subsequent all pairwise comparison procedure by student t-test.
Fig 2
Fig 2
A. Nicotine induces OPN promoter activity in AsPC-1 cells. After 24 h of transfection, the cells were incubated with nicotine (3×10⁻⁹ – 3×10⁻⁷ mol/L) for 3 hours. After incubation, the luciferase activity in the cell lysates was measured. Nicotine increased OPN promoter activity with maximum induction at 3×10⁻⁹ mol/L. Relative luciferase activity was calculated after deduction of the activity levels with pGL3 vector alone. Results represent mean ± SEM of triplicate determinations. All experiments were repeated at least three times to confirm the reproducibility of the observations. B. nAChR antagonist blocks nicotine-induced OPN mRNA expression in AsPC-1 cells. Cells were preincubated for 1 h with nAChR antagonist mechamylamine before addition of nicotine (3×10⁻⁸ mol/L) for 3 h. Mechamylamine induced a dose-dependent reduction in OPN mRNA levels. Values are expressed as mean ± SEM of three experiments. *p < 0.05 vs. nicotine alone treated cells using one-way repeated ANOVA with subsequent all pairwise comparison procedure by student t-test.
Fig 2
Fig 2
A. Nicotine induces OPN promoter activity in AsPC-1 cells. After 24 h of transfection, the cells were incubated with nicotine (3×10⁻⁹ – 3×10⁻⁷ mol/L) for 3 hours. After incubation, the luciferase activity in the cell lysates was measured. Nicotine increased OPN promoter activity with maximum induction at 3×10⁻⁹ mol/L. Relative luciferase activity was calculated after deduction of the activity levels with pGL3 vector alone. Results represent mean ± SEM of triplicate determinations. All experiments were repeated at least three times to confirm the reproducibility of the observations. B. nAChR antagonist blocks nicotine-induced OPN mRNA expression in AsPC-1 cells. Cells were preincubated for 1 h with nAChR antagonist mechamylamine before addition of nicotine (3×10⁻⁸ mol/L) for 3 h. Mechamylamine induced a dose-dependent reduction in OPN mRNA levels. Values are expressed as mean ± SEM of three experiments. *p < 0.05 vs. nicotine alone treated cells using one-way repeated ANOVA with subsequent all pairwise comparison procedure by student t-test.
Figure 3
Figure 3
Nicotine-induced OPN gene expression requires both tyrosine kinase and ERK1/2 MAP kinase activity. A. The protein tyrosine phosphatase inhibitor sodium orthovanadate induces OPN mRNA accumulation in AsPC-1 cells. Cells were treated with sodium orthovanadate (10–50 uM) for 3 h. OPN mRNA levels were determined by real time PCR. *p < 0.05 # p< 0.02 vs. control untreated cells using one-way repeated ANOVA with subsequent all pairwise comparison procedure by student t-test. B. The tyrosine kinase inhibitor genistein blocks nicotine-induced OPN mRNA accumulation in AsPC-1 cells. Cells were pretreated with genistein for 1 h (60 µM) then exposed to nicotine (3×10⁻⁸mol/L) for 3 h. Three independent experiments showed similar results. *p < 0.05 vs. nicotine treated cells using one-way repeated ANOVA with subsequent all pairwise comparison procedure by student t-test. C. Genistein reduces OPN promoter activity in AsPC-1 cells. After 24 h of transfection, the cells were incubated with genistein (15–60 µM) for 3 hours. After incubation, the luciferase activity in the cell lysates was measured. Genistein reduced OPN promoter activity with maximum reduction at 60 µM. Relative luciferase activity was calculated after deduction of the activity levels with pGL3 vector alone. Results represent mean ± SEM of triplicate determinations. All experiments were repeated at least three times to confirm the reproducibility of the observations. D. Genistein reduces AsPC-1 cell proliferation. Cells were incubated with genistein (15–60 µM) for 24 and 72 h. Genistein dose dependently (30–60 µM) reduced cellular proliferation at the two time points. *p < 0.05 vs. control, using one-way repeated ANOVA with subsequent all pairwise comparison procedure by student t-test.
Fig 4
Fig 4
Time dependent activation of ERK1/2 MAP kinase signaling pathway by nicotine in AsPC-1 cells. A. Representative Western blot probed with phospho antibody against the activated from of ERK1/2 showing increased phosphorylation of ERK1/2 after incubation of nicotine (3×10⁻⁸ mol/L) 5–60 min. Blots were stripped and developed with anti- total ERK1/2 as control for equal protein loading. B. Effect of MAPKK inhibitor, PD098059, on nicotine induced increase in OPN mRNA. Cells were pretreated with the inhibitor (0.1–10 µM) for 10 minutes before incubation with nicotine (3×10⁻⁸mol/L) for 3 h. Data represent three independent experiments. *p < 0.05 # p<0.002 vs. nicotine treated cells using one-way repeated ANOVA with subsequent all pairwise comparison procedure by student t-test. C. PD098059 reduces OPN promoter activity in AsPC-1 cells. After 24 h of transfection, the cells were incubated with PD098059 (0.1–10 µM) for 3 hours. After incubation, the luciferase activity in the cell lysates was measured. PD098059 reduced OPN promoter activity with maximum reduction at 10 µM. Relative luciferase activity was calculated after deduction of the activity levels with pGL3 vector alone. Results represent mean ± SEM of triplicate determinations. All experiments were repeated at least three times to confirm the reproducibility of the observations. D. PD098059 reduces AsPC-1 cell proliferation. Cells were incubated with PD098059 (0.1–10 µM) for 24 and 72 h. PD098059 (10 µM) reduced cellular proliferation at the two time points at. *p < 0.05 vs. control, using one-way repeated ANOVA with subsequent all pairwise comparison procedure by student t-test.
Fig 4
Fig 4
Time dependent activation of ERK1/2 MAP kinase signaling pathway by nicotine in AsPC-1 cells. A. Representative Western blot probed with phospho antibody against the activated from of ERK1/2 showing increased phosphorylation of ERK1/2 after incubation of nicotine (3×10⁻⁸ mol/L) 5–60 min. Blots were stripped and developed with anti- total ERK1/2 as control for equal protein loading. B. Effect of MAPKK inhibitor, PD098059, on nicotine induced increase in OPN mRNA. Cells were pretreated with the inhibitor (0.1–10 µM) for 10 minutes before incubation with nicotine (3×10⁻⁸mol/L) for 3 h. Data represent three independent experiments. *p < 0.05 # p<0.002 vs. nicotine treated cells using one-way repeated ANOVA with subsequent all pairwise comparison procedure by student t-test. C. PD098059 reduces OPN promoter activity in AsPC-1 cells. After 24 h of transfection, the cells were incubated with PD098059 (0.1–10 µM) for 3 hours. After incubation, the luciferase activity in the cell lysates was measured. PD098059 reduced OPN promoter activity with maximum reduction at 10 µM. Relative luciferase activity was calculated after deduction of the activity levels with pGL3 vector alone. Results represent mean ± SEM of triplicate determinations. All experiments were repeated at least three times to confirm the reproducibility of the observations. D. PD098059 reduces AsPC-1 cell proliferation. Cells were incubated with PD098059 (0.1–10 µM) for 24 and 72 h. PD098059 (10 µM) reduced cellular proliferation at the two time points at. *p < 0.05 vs. control, using one-way repeated ANOVA with subsequent all pairwise comparison procedure by student t-test.
Figure 5
Figure 5
High dose cigarette smoke causes structural changes in the rat pancreas. A. Staining of frozen sections of pancreata from different group revealed the presence of areas of necrosis and connective tissue deposition in the rats treated with high dose of cigarette smoke. The changes were noticed in the interlobular regions in the areas surrounding the ducts (arrows). B. Representative immunofluorescence staining using OPN antibody shows expression of OPN in the islets of the normal rat pancreas. Negative control samples where the primary antibody was omitted did not show non-specific reaction. X 200 original magnification. C. Representative immunofluorescence staining of rat pancreata from the different groups revealed increased expression of OPN protein in the CT in the rats exposed to high dose of cigarette smoke, especially in the inter- and interlobular connective tissue. X 200 original magnification. D. Pancreatic staining of OPN. Staining was analyzed by image analysis and expressed as percentage area stained as described in Materials and Methods. There was minimal staining in the sham and low dose groups. High dose group showed markedly significant increase in staining. E. Real time PCR analysis of OPN mRNA expression in the different rat groups shows significant increases in OPN mRNA in the pancreata of rats exposed to high dose of smoke. * p<0.05 vs. sham levels using one-way repeated ANOVA with subsequent all pairwise comparison procedure by student t-test.
Figure 5
Figure 5
High dose cigarette smoke causes structural changes in the rat pancreas. A. Staining of frozen sections of pancreata from different group revealed the presence of areas of necrosis and connective tissue deposition in the rats treated with high dose of cigarette smoke. The changes were noticed in the interlobular regions in the areas surrounding the ducts (arrows). B. Representative immunofluorescence staining using OPN antibody shows expression of OPN in the islets of the normal rat pancreas. Negative control samples where the primary antibody was omitted did not show non-specific reaction. X 200 original magnification. C. Representative immunofluorescence staining of rat pancreata from the different groups revealed increased expression of OPN protein in the CT in the rats exposed to high dose of cigarette smoke, especially in the inter- and interlobular connective tissue. X 200 original magnification. D. Pancreatic staining of OPN. Staining was analyzed by image analysis and expressed as percentage area stained as described in Materials and Methods. There was minimal staining in the sham and low dose groups. High dose group showed markedly significant increase in staining. E. Real time PCR analysis of OPN mRNA expression in the different rat groups shows significant increases in OPN mRNA in the pancreata of rats exposed to high dose of smoke. * p<0.05 vs. sham levels using one-way repeated ANOVA with subsequent all pairwise comparison procedure by student t-test.
Figure 6
Figure 6
Expression of OPN in human tissue. A. Real time PCR analysis of OPN mRNA in non-malignant pancreatic tissues, premalignant lesions, and invasive PDA. Significantly higher OPN mRNA levels are seen in invasive PDA. Analysis of patient history of the samples used for OPN analysis shows that invasive PDA patients were mostly (64%) smokers, while a the majority (73%) of patients with premalignant lesions were non smokers* p<0.05 vs. non-malignant levels using one-way repeated ANOVA with subsequent all pairwise comparison procedure by student t-test. B. Representative immunohistochemical staining for OPN in non-malignant pancreatic tissue. Paraffin embedded pancreatic sections were stained with OPN antibody. In the non malignant ducts OPN is focally present and mostly on the apical surface of the ductal epithelium (× 400 original magnification). C. In PanIN lesions OPN staining was seen in the transforming ducts (× 100 original magnification). D. In invasive PDA, intense OPN is localized to the membrane and cytoplasm of the tumor cells (×200 original magnification). E. Compared to non-malignant tissue, intense OPN staining is seen in the acini neighboring the malignant lesions (×100 original magnification). Negative control (Neg C) sections where the primary antibody was not added did not show non-specific reaction
Figure 6
Figure 6
Expression of OPN in human tissue. A. Real time PCR analysis of OPN mRNA in non-malignant pancreatic tissues, premalignant lesions, and invasive PDA. Significantly higher OPN mRNA levels are seen in invasive PDA. Analysis of patient history of the samples used for OPN analysis shows that invasive PDA patients were mostly (64%) smokers, while a the majority (73%) of patients with premalignant lesions were non smokers* p<0.05 vs. non-malignant levels using one-way repeated ANOVA with subsequent all pairwise comparison procedure by student t-test. B. Representative immunohistochemical staining for OPN in non-malignant pancreatic tissue. Paraffin embedded pancreatic sections were stained with OPN antibody. In the non malignant ducts OPN is focally present and mostly on the apical surface of the ductal epithelium (× 400 original magnification). C. In PanIN lesions OPN staining was seen in the transforming ducts (× 100 original magnification). D. In invasive PDA, intense OPN is localized to the membrane and cytoplasm of the tumor cells (×200 original magnification). E. Compared to non-malignant tissue, intense OPN staining is seen in the acini neighboring the malignant lesions (×100 original magnification). Negative control (Neg C) sections where the primary antibody was not added did not show non-specific reaction

Similar articles

Cited by

References

    1. Jemal A, Siegel R, Ward E, Murray T, Thun MJ. Cancer Statistics, 2007. CA Cancer J Clin. 2007;57:43–66. - PubMed
    1. Bellahcène A, Castronovo V, Ogbureke KU, Fisher LW, Fedarko NS. Small integrin-binding ligand N-linked glycoproteins (SIBLINGs): multifunctional proteins in cancer. Nat Rev Cancer. 2008;8:212–226. - PMC - PubMed
    1. Denhardt DT, Noda M, O'Regan AW, Pavlin D, Berman JS. Osteopontin as a means to cope with environmental insults: regulation of inflammation, tissue remodeling, and cell survival. J Clin Invest. 2001;107:1055–1061. - PMC - PubMed
    1. Khan SA, Cook AC, Kappil M, Günthert U, Chambers AF, Tuck AB, Denhardt DT. Enhanced cell surface CD44 variant (v6, v9) expression by osteopontin in breast cancer epithelial cells facilitates tumor cell migration: novel post-transcriptional, post-translational regulation. Clin Exp Metastasis. 2005;22(8):663–673. - PubMed
    1. Jain S, Chakraborty G, Bulbule A, Kaur R, Kundu GC. Osteopontin: an emerging therapeutic target for anticancer therapy. Expert Opin Ther Targets. 2007;1:81–90. - PubMed

Publication types

MeSH terms