. 2009 Jul 1;125(1):235-43.
doi: 10.1002/ijc.24331.

The antiretroviral nucleoside analogue Abacavir reduces cell growth and promotes differentiation of human medulloblastoma cells

Affiliations

The antiretroviral nucleoside analogue Abacavir reduces cell growth and promotes differentiation of human medulloblastoma cells

Alessandra Rossi et al. Int J Cancer. .

Abstract

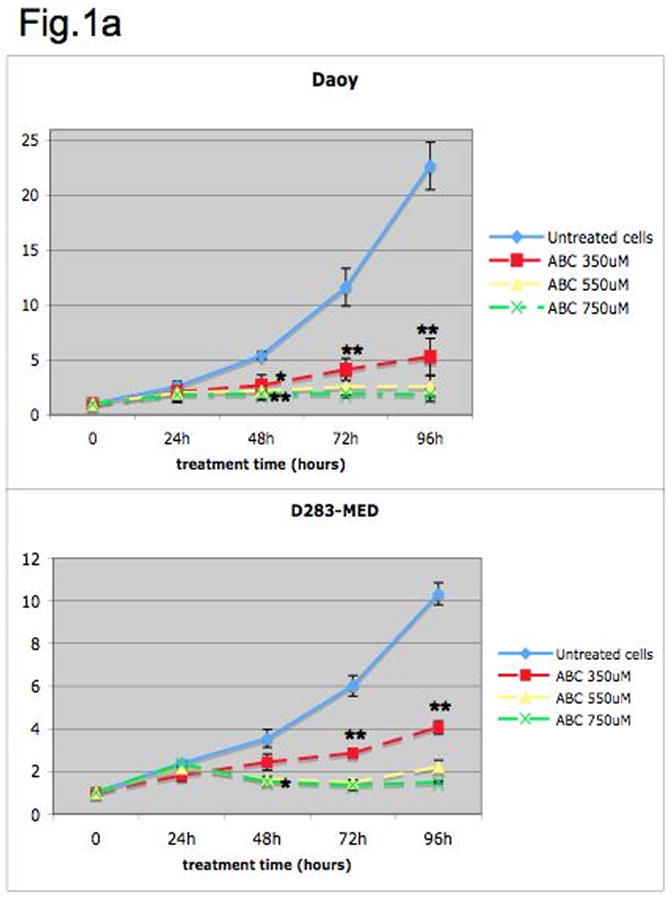
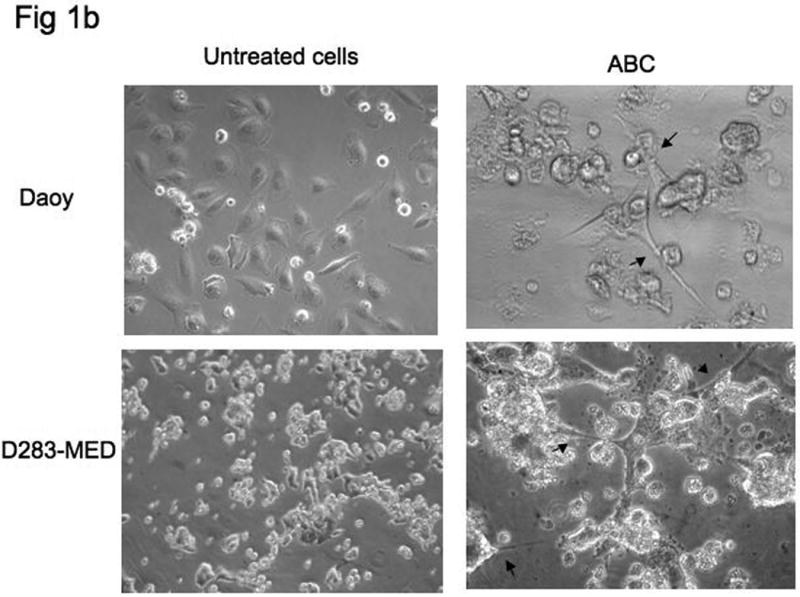
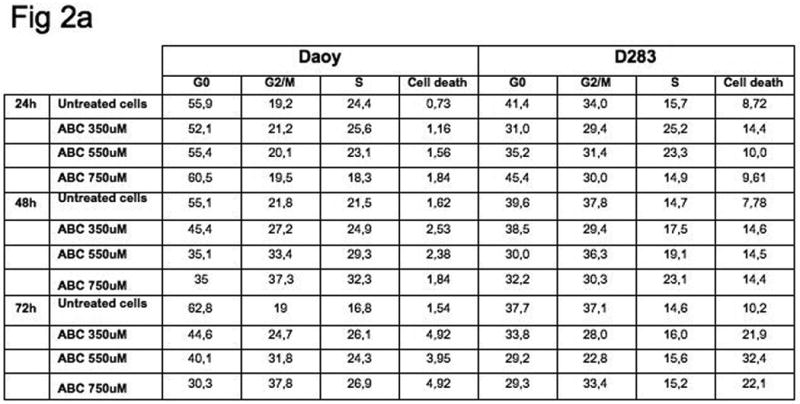
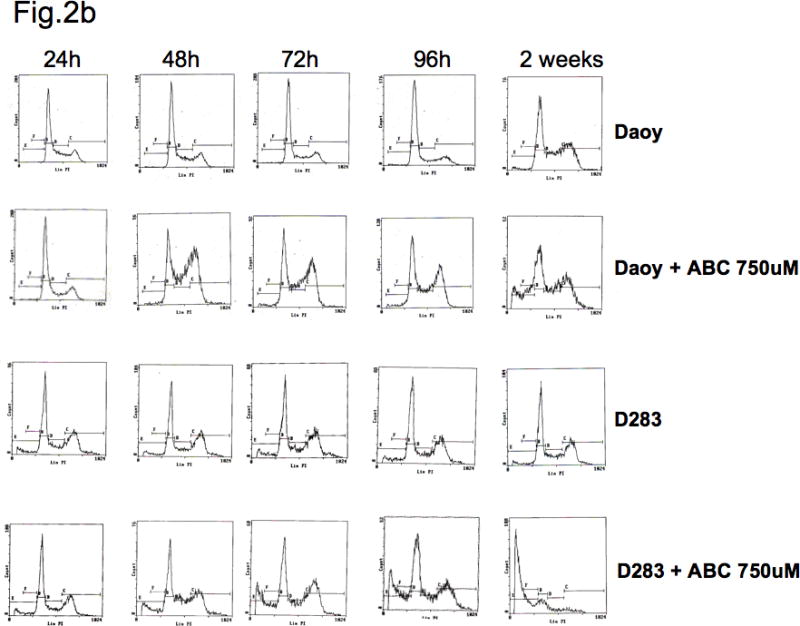
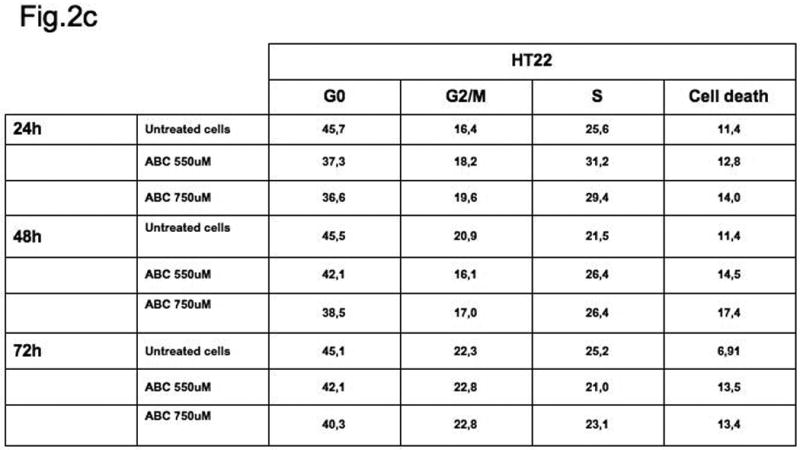
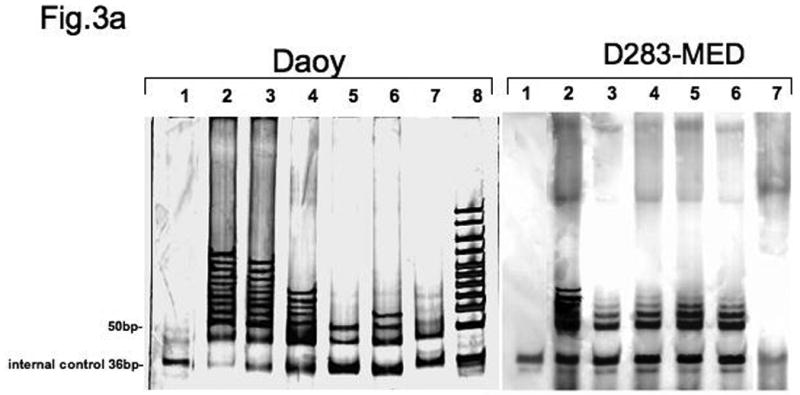
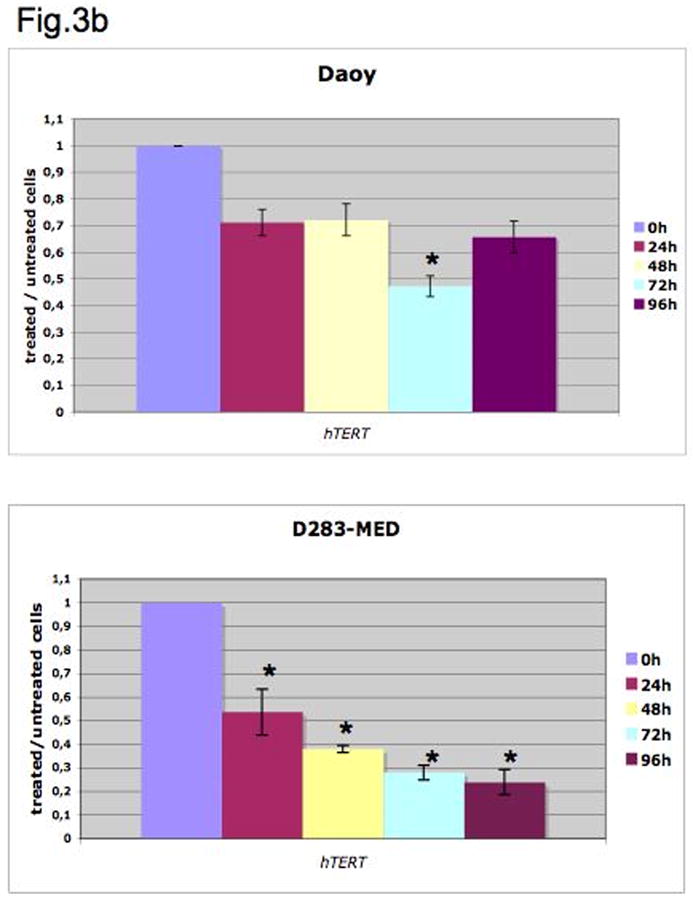
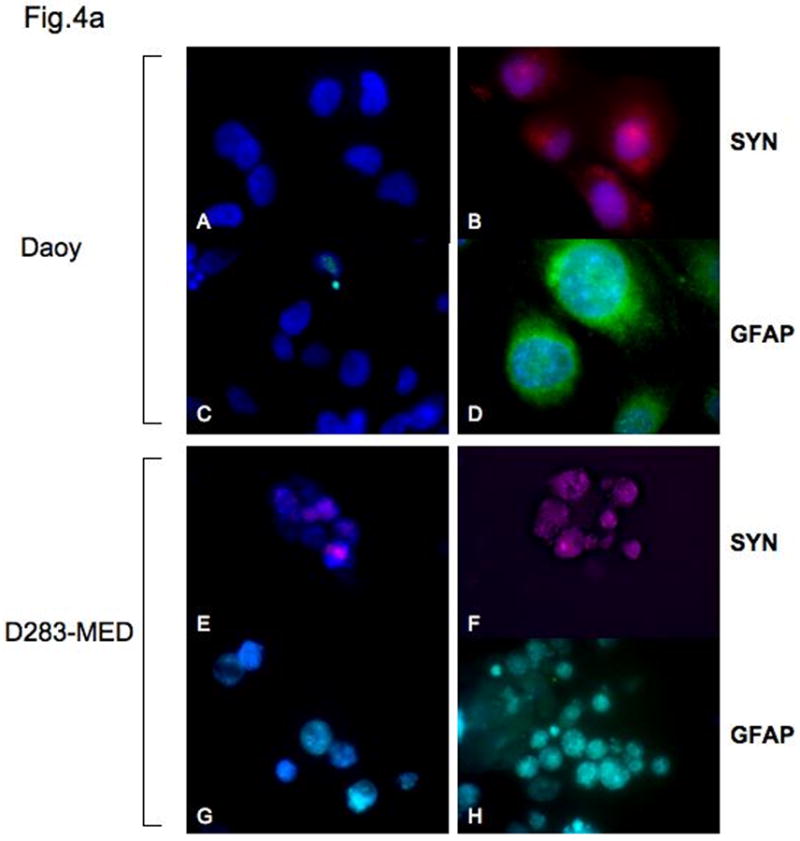
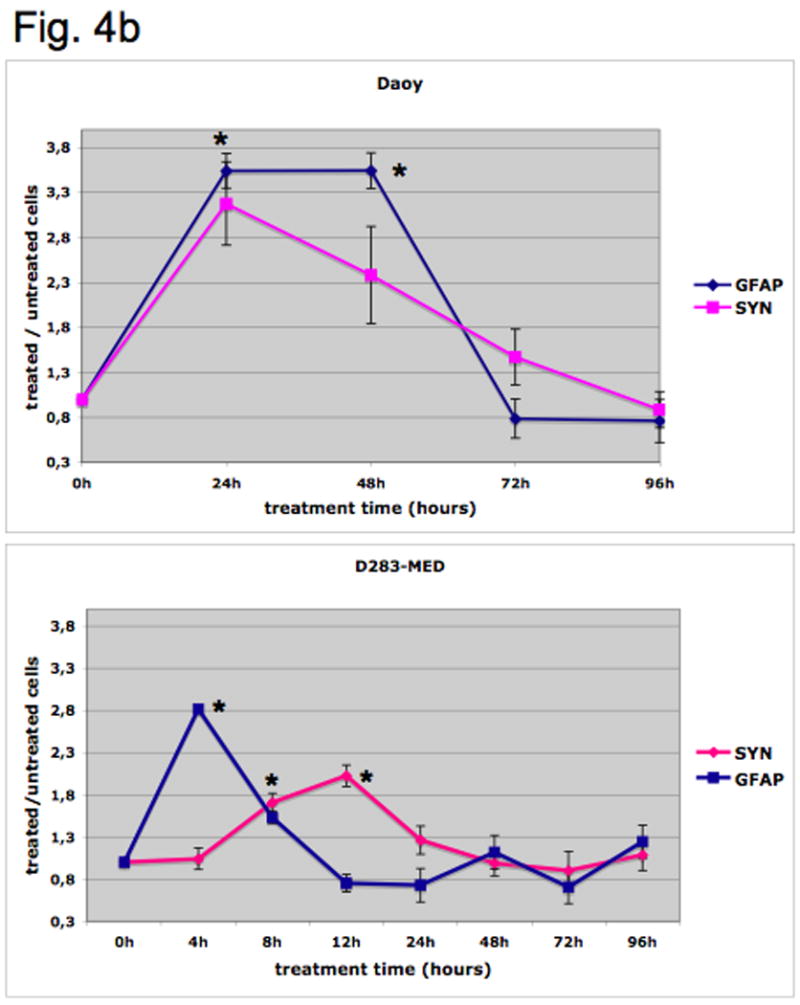
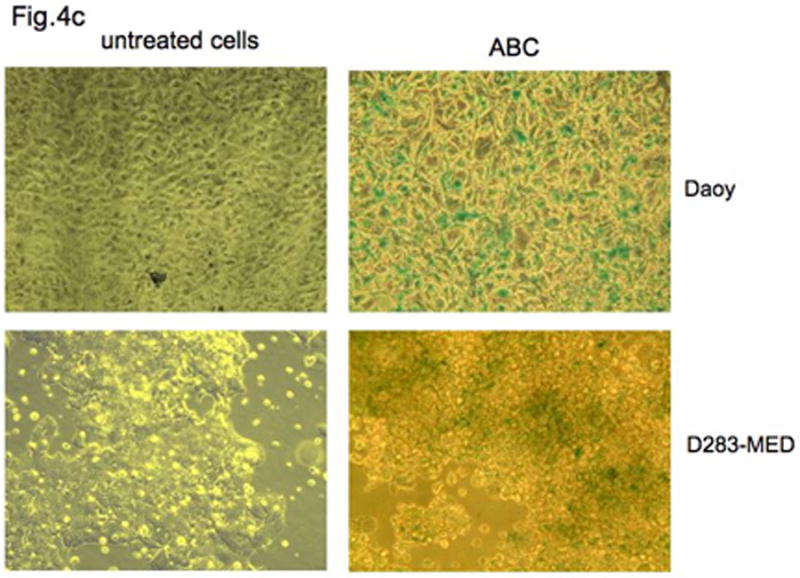
Abacavir is one of the most efficacious nucleoside analogues, with a well-characterized inhibitory activity on reverse transcriptase enzymes of retroviral origin, and has been clinically approved for the treatment of AIDS. Recently, Abacavir has been shown to inhibit also the human telomerase activity. Telomerase activity seems to be required in essentially all tumours for the immortalization of a subset of cells, including cancer stem cells. In fact, many cancer cells are dependent on telomerase for their continued replication and therefore telomerase is an attractive target for cancer therapy. Telomerase expression is upregulated in primary primitive neuroectodermal tumours and in the majority of medulloblastomas suggesting that its activation is associated with the development of these diseases. Therefore, we decided to test Abacavir activity on human medulloblastoma cell lines with high telomerase activity. We report that exposure to Abacavir induces a dose-dependent decrease in the proliferation rate of medulloblastoma cells. This is associated with a cell accumulation in the G(2)/M phase of the cell cycle in the Daoy cell line, and with increased cell death in the D283-MED cell line, and is likely to be dependent on the inhibition of telomerase activity. Interestingly, both cell lines showed features of senescence after Abacavir treatment. Moreover, after Abacavir exposure we detected, by immunofluorescence staining, increased protein expression of the glial marker glial fibrillary acidic protein and the neuronal marker synaptophysin in both medulloblastoma cell lines. In conclusion, our results suggest that Abacavir reduces proliferation and induces differentiation of human medulloblastoma cells through the downregulation of telomerase activity. Thus, using Abacavir, alone or in combination with current therapies, might be an effective therapeutic strategy for the treatment of medulloblastoma.


Figures

Figure 1
Figure 1
Proliferation of human medulloblastoma cell lines Daoy and D283-MED treated with Abacavir (ABC). (a) Cells were cultured with different doses of ABC (dashed lines) and in drug-free medium (solid line). The cell proliferation rate is indicated as the ratio of cell number at each time point relative to the initial number of seeded cells, taken as 1. These results are expressed as the mean value of at least two independent assays; bars, ± SD. The (*) and (**) symbols denote significance difference of p<0.05 and p<0.001, respectively, from untreated cells control. (b) ABC induces morphologic differentiation in medulloblastoma cells. Daoy and D283-MED cells were cultured in the presence of 750μM ABC for 2 weeks; ABC-containing fresh medium was changed at 72h intervals. arrows, neurite formations. Photographs were obtained by phase contrast microscopy. (c) Morphologic features of neurons in primary culture on phase-contrast microscopy. Cells were treated with ABC (750μM) for 24, 48 and 72 h.
Figure 1
Figure 1
Proliferation of human medulloblastoma cell lines Daoy and D283-MED treated with Abacavir (ABC). (a) Cells were cultured with different doses of ABC (dashed lines) and in drug-free medium (solid line). The cell proliferation rate is indicated as the ratio of cell number at each time point relative to the initial number of seeded cells, taken as 1. These results are expressed as the mean value of at least two independent assays; bars, ± SD. The (*) and (**) symbols denote significance difference of p<0.05 and p<0.001, respectively, from untreated cells control. (b) ABC induces morphologic differentiation in medulloblastoma cells. Daoy and D283-MED cells were cultured in the presence of 750μM ABC for 2 weeks; ABC-containing fresh medium was changed at 72h intervals. arrows, neurite formations. Photographs were obtained by phase contrast microscopy. (c) Morphologic features of neurons in primary culture on phase-contrast microscopy. Cells were treated with ABC (750μM) for 24, 48 and 72 h.
Figure 2
Figure 2
Flow cytometric profiles of Daoy and D283-MED medulloblastoma cells and HT22 neuronal cell line before and following exposure to Abacavir (ABC). (a) FACS analysis was performed after 24, 48, 72, 96 h and 2 weeks following 750μM ABC treatment. A consistent shift of the cell population toward the G2/M phase of the cell cycle was observed in treated Daoy cells and an increased percentage of cell death was evidenced in D283-MED. (b) The percentages of cells in the different phases of cell cycle are reported for each representative time point. The data shown are representative of at least two independent experiments. (c) No differences in cell cycle profile were evidenced in HT22 cells treated with 750μM ABC, compared to untreated cell.
Figure 2
Figure 2
Flow cytometric profiles of Daoy and D283-MED medulloblastoma cells and HT22 neuronal cell line before and following exposure to Abacavir (ABC). (a) FACS analysis was performed after 24, 48, 72, 96 h and 2 weeks following 750μM ABC treatment. A consistent shift of the cell population toward the G2/M phase of the cell cycle was observed in treated Daoy cells and an increased percentage of cell death was evidenced in D283-MED. (b) The percentages of cells in the different phases of cell cycle are reported for each representative time point. The data shown are representative of at least two independent experiments. (c) No differences in cell cycle profile were evidenced in HT22 cells treated with 750μM ABC, compared to untreated cell.
Figure 3
Figure 3
Abacavir (ABC) inhibits telomerase activity and downregulates hTERT mRNA. (a) Detection of telomerase activity in medulloblastoma cells by TRAP assay. The detection of 6bp ladders indicates the presence of telomerase activity. Daoy and D283-MED cells are telomerase positive and heat treatment of the protein extract abolished the telomerase activity, as assessed by the TRAP assay. A reduction of telomerase activity was observed in both cell lines beginning from 1 d of treatment with 750μM of ABC. Lane 1, heat-treated protein extracts from Daoy or D283-MED; lane 2, untreated cells; lane 3, 4, 5 and 6, cells treated with ABC for 24, 48, 72 and 96 h; lane 7, the primer-dimers/PCR control; lane 8, 100bp DNA ladder. (b) Expression of hTERT mRNA in Daoy and D283-MED cells was determined by real time RT-PCR. Data shown are representative of at least two independent experiments; bars, ± SD. The (*) symbol denotes significance difference of p<0.05 from untreated cells control.
Figure 3
Figure 3
Abacavir (ABC) inhibits telomerase activity and downregulates hTERT mRNA. (a) Detection of telomerase activity in medulloblastoma cells by TRAP assay. The detection of 6bp ladders indicates the presence of telomerase activity. Daoy and D283-MED cells are telomerase positive and heat treatment of the protein extract abolished the telomerase activity, as assessed by the TRAP assay. A reduction of telomerase activity was observed in both cell lines beginning from 1 d of treatment with 750μM of ABC. Lane 1, heat-treated protein extracts from Daoy or D283-MED; lane 2, untreated cells; lane 3, 4, 5 and 6, cells treated with ABC for 24, 48, 72 and 96 h; lane 7, the primer-dimers/PCR control; lane 8, 100bp DNA ladder. (b) Expression of hTERT mRNA in Daoy and D283-MED cells was determined by real time RT-PCR. Data shown are representative of at least two independent experiments; bars, ± SD. The (*) symbol denotes significance difference of p<0.05 from untreated cells control.
Figure 4
Figure 4
Abacavir (ABC) induces differentiation and cellular senescence in medulloblastoma cells. (a) Immunofluorescence staining for GFAP and SYN proteins in Daoy and D283-MED cells. Expression of GFAP and SYN protein was evident in cells treated with 750μM ABC for 3 d (B,D,F,H) respect to untreated cells, which are negative for or have lower levels of these proteins (A,C,E,G). All photomicrographs were taken with the same magnification. (b) GFAP and SYN mRNA levels as detected by real-time RT-PCR in medulloblastoma cells during the treatment with ABC. Both GFAP and SYN mRNA expression increased after exposure to the drug. Data shown are representative of at least two independent experiments; bars, ± SD. The (*) symbol denotes significance difference of p<0.05 from untreated cells control. (c) β-galactosidase staining in Daoy and D283-MED after 1 week of treatment with 350μM ABC, and the corresponding controls (untreated cells). Blue staining indicates senescent cells.
Figure 4
Figure 4
Abacavir (ABC) induces differentiation and cellular senescence in medulloblastoma cells. (a) Immunofluorescence staining for GFAP and SYN proteins in Daoy and D283-MED cells. Expression of GFAP and SYN protein was evident in cells treated with 750μM ABC for 3 d (B,D,F,H) respect to untreated cells, which are negative for or have lower levels of these proteins (A,C,E,G). All photomicrographs were taken with the same magnification. (b) GFAP and SYN mRNA levels as detected by real-time RT-PCR in medulloblastoma cells during the treatment with ABC. Both GFAP and SYN mRNA expression increased after exposure to the drug. Data shown are representative of at least two independent experiments; bars, ± SD. The (*) symbol denotes significance difference of p<0.05 from untreated cells control. (c) β-galactosidase staining in Daoy and D283-MED after 1 week of treatment with 350μM ABC, and the corresponding controls (untreated cells). Blue staining indicates senescent cells.

Similar articles

Cited by

References

    1. Harley CB. Telomerase and cancer therapeutics. Nat Rev Cancer. 2008;8:167–79. - PubMed
    1. Phatak P, Burger AM. Telomerase and its potential for therapeutic intervention. Br J Pharmacol. 2007;152:1003–11. - PMC - PubMed
    1. Hamad NM, Banik SS, Counter CM. Mutational analysis defines a minimum level of telomerase activity required for tumourigenic growth of human cells. Oncogene. 2002;21:7121–5. - PubMed
    1. Shay JW, Keith WN. Targeting telomerase for cancer therapeutics. Br J Cancer. 2008;98:677–83. - PMC - PubMed
    1. Kim NW, Hruszkewycz AM. Telomerase activity modulation in the prevention of prostate cancer. Urology. 2001;57:148–53. - PubMed

Publication types

MeSH terms