. 2009 Jun 5;389(2):248-63.
doi: 10.1016/j.jmb.2009.03.067. Epub 2009 Apr 7.

Topologies of complexes containing O6-alkylguanine-DNA alkyltransferase and DNA

Affiliations

Topologies of complexes containing O6-alkylguanine-DNA alkyltransferase and DNA

Claire A Adams et al. J Mol Biol. .

Abstract

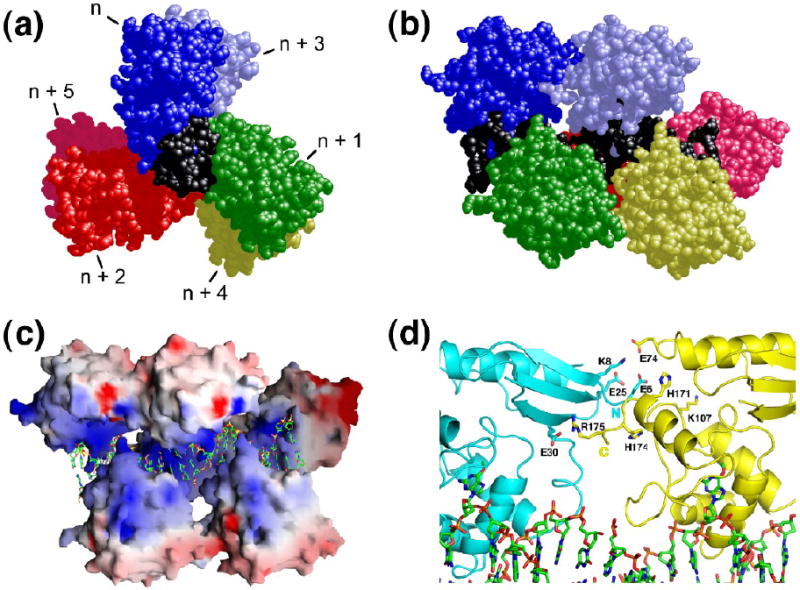
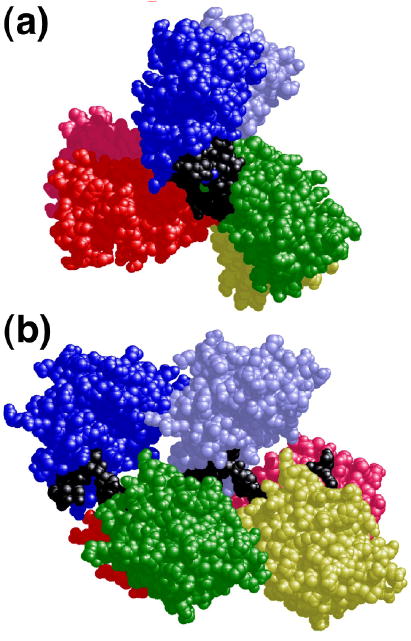
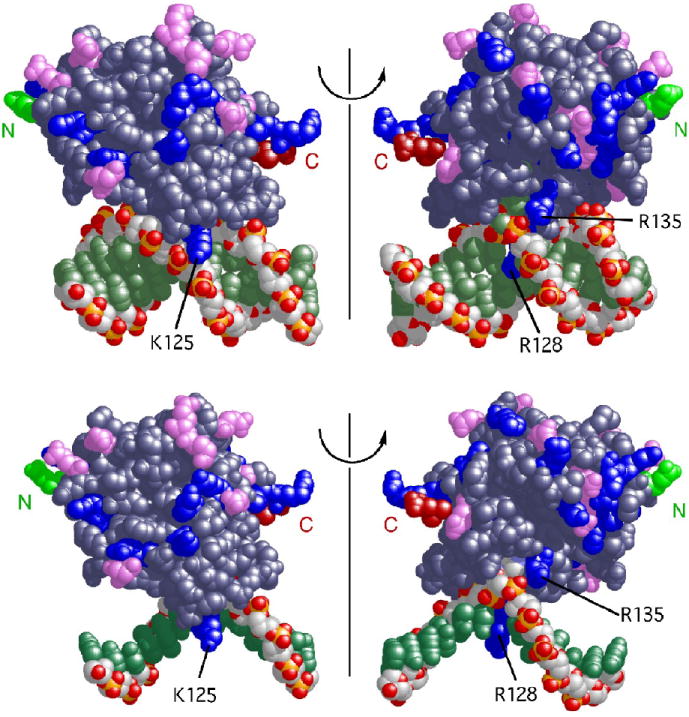
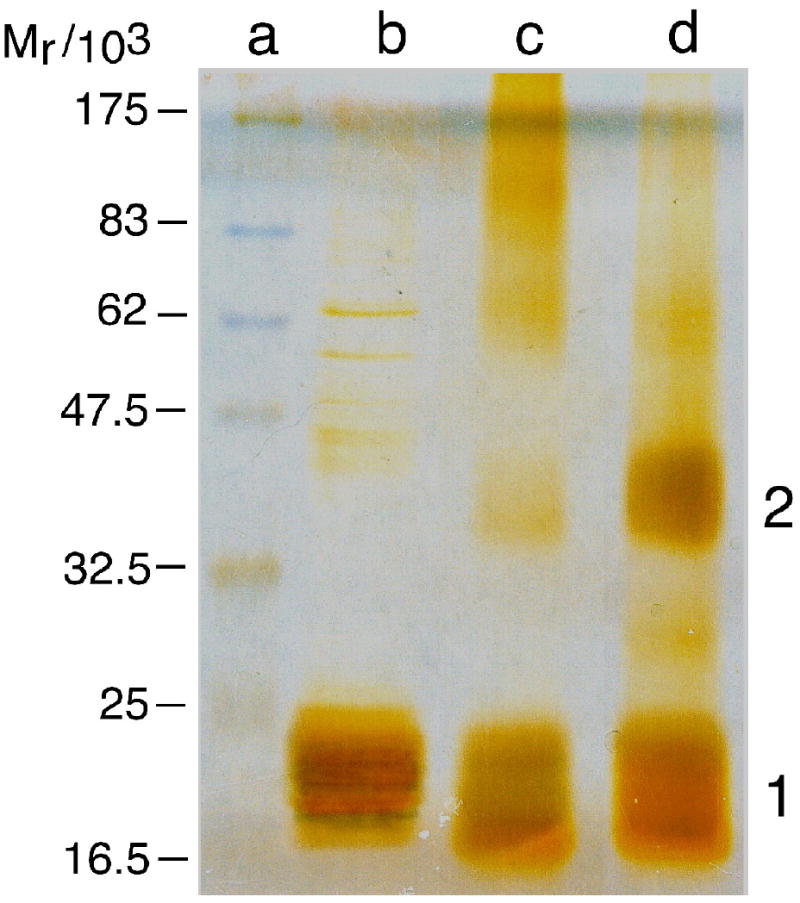
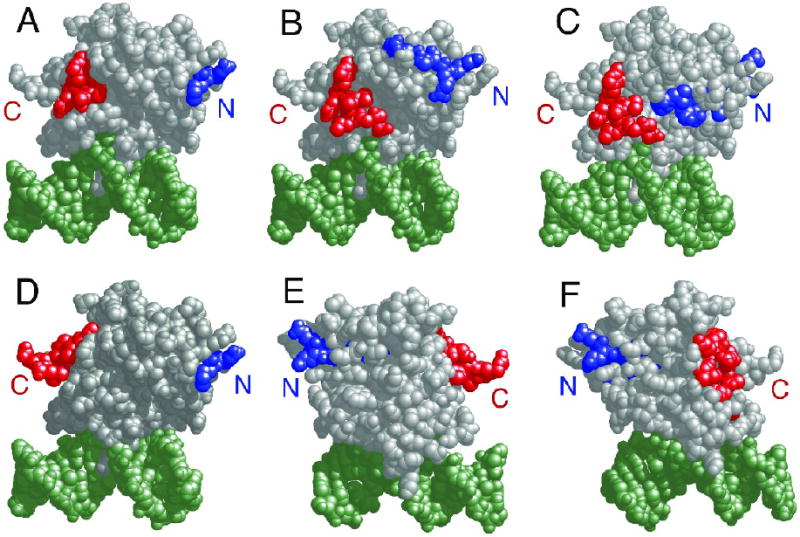
The mutagenic and cytotoxic effects of many alkylating agents are reduced by O(6)-alkylguanine-DNA alkyltransferase (AGT). In humans, this protein not only protects the integrity of the genome, but also contributes to the resistance of tumors to DNA-alkylating chemotherapeutic agents. Here we describe and test models for cooperative multiprotein complexes of AGT with single-stranded and duplex DNAs that are based on in vitro binding data and the crystal structure of a 1:1 AGT-DNA complex. These models predict that cooperative assemblies contain a three-start helical array of proteins with dominant protein-protein interactions between the amino-terminal face of protein n and the carboxy-terminal face of protein n+3, and they predict that binding duplex DNA does not require large changes in B-form DNA geometry. Experimental tests using protein cross-linking analyzed by mass spectrometry, electrophoretic and analytical ultracentrifugation binding assays, and topological analyses with closed circular DNA show that the properties of multiprotein AGT-DNA complexes are consistent with these predictions.


Figures

Figure 1
Figure 1
Models of AGT-DNA complexes with double-stranded DNA. Panels a and b: Model of the cooperative complex formed with duplex DNA. The repeating unit of this model is one molecule of AGT (colors) plus 4 base-pairs of DNA (black); the coordinates were derived from the crystal structure of Daniels et al.. Repeating units were juxtaposed with preservation of B-DNA helical parameters (separation =3.4 Å, twist = 34.6 degrees) between base-pairs of adjacent units. The result is a 3-start helical array (panel a) with important contacts between proteins n and n + 3 (panel b). Electrostatic potentials calculated with for the protein array using the program GRASP are shown in panel c. Potentials ranged from -8kT (red) to +8kT (blue). In panel a, the C-terminal surfaces of proteins are shown. In panels b and c, the C-termini are oriented to the left. Panel d: Interface between proteins n (cyan) and n + 3 (yellow), view perpendicular to the DNA axis. Proteins are oriented with N-termini to the right; for clarity only charged side chains in the interface are shown. This view emphasizes surface and charge complementarities generated by the model without conformational adjustment of proteins or DNA.
Figure 2
Figure 2
A model of AGT-DNA complexes containing single-stranded DNA. Panel a: view parallel to the DNA axis. The C-terminal faces of proteins are shown. Panel b: view perpendicular to the DNA axis. The C-termini of proteins are toward the left. The color scheme is the same as that used in Fig. 1. This model was built from the model containing duplex DNA (Fig. 1, panels a and b), retaining the DNA strand with extrahelical bases bound by the enzyme and deleting the complementary DNA strand. No conformational adjustment or energy minimization has been done.
Figure 3
Figure 3
Interactions predicted by the structural model. Panel a: protein-protein contacts. This representation contains 4 protein molecules bound to 16 bp of duplex DNA. Proteins are oriented with N-terminal surfaces toward the right. Protein monomers colored blue and pink are in contact; contact residues on the N-terminal face (residues 6-9; 25, 26, 29, 30, 32, 85-87 and 91) are colored deep blue, contact residues on the C-terminal face (residues 73, 74, 108, 109 and 171-176) are colored red. A subset of these residues are indicated by number. The DNA is shown in black. Panel b: Structural models predict 3 ionic contacts with duplex DNA and 2 contacts with single stranded DNA. A single protein-DNA unit is shown. The model containing duplex DNA (top row) is the structure specified by PDB file 1T38. The model for the complex with single stranded DNA (bottom row) is isosteric with that for duplex DNA, except that the least-contacted DNA strand has been deleted. Two rotational orientations of each structure are shown. Basic protein residues are colored blue, acidic residues, violet; the amino-terminal residues in the structure are colored green and labeled N, the carboxy-terminal residues are colored red and labeled C. Residues R128 and R135 are positioned to contact both single stranded and duplex DNAs, while in the absence of allosteric adjustment, residue K125 is positioned to contact only duplex DNA.
Figure 3
Figure 3
Interactions predicted by the structural model. Panel a: protein-protein contacts. This representation contains 4 protein molecules bound to 16 bp of duplex DNA. Proteins are oriented with N-terminal surfaces toward the right. Protein monomers colored blue and pink are in contact; contact residues on the N-terminal face (residues 6-9; 25, 26, 29, 30, 32, 85-87 and 91) are colored deep blue, contact residues on the C-terminal face (residues 73, 74, 108, 109 and 171-176) are colored red. A subset of these residues are indicated by number. The DNA is shown in black. Panel b: Structural models predict 3 ionic contacts with duplex DNA and 2 contacts with single stranded DNA. A single protein-DNA unit is shown. The model containing duplex DNA (top row) is the structure specified by PDB file 1T38. The model for the complex with single stranded DNA (bottom row) is isosteric with that for duplex DNA, except that the least-contacted DNA strand has been deleted. Two rotational orientations of each structure are shown. Basic protein residues are colored blue, acidic residues, violet; the amino-terminal residues in the structure are colored green and labeled N, the carboxy-terminal residues are colored red and labeled C. Residues R128 and R135 are positioned to contact both single stranded and duplex DNAs, while in the absence of allosteric adjustment, residue K125 is positioned to contact only duplex DNA.
Figure 4
Figure 4
Crosslinking and mass spectroscopy analysis of AGT-DNA complexes. Panel a: Formaldehyde crosslinking of AGT-complexes detected by SDS-PAGE. Lane a, molecular weight standards (scale shown at left). Lane b, uncrosslinked AGT (15.8 μM). Lane c, AGT (15.8 μM) crosslinked in the absence of DNA for 120 min with formaldehyde (5 mM). Lane d, AGT (15.8 μM) plus 16mer DNA (15.8μM) crosslinked for 120 min with formaldehyde (5 mM). Samples (30 μL) were resolved in a 15% SDS-polyacrylamide gel. Protein bands were detected by silver-staining. Band assignments 1, monomer; 2, dimer based on apparent molecular weight. Panel b: Representative MALDI-mass spectra of trypsin fragments obtained from crosslinked AGT monomer (upper panel) and dimer (lower panel). Protein digestion and mass spectroscopy conditions were as described in Methods.
Figure 4
Figure 4
Crosslinking and mass spectroscopy analysis of AGT-DNA complexes. Panel a: Formaldehyde crosslinking of AGT-complexes detected by SDS-PAGE. Lane a, molecular weight standards (scale shown at left). Lane b, uncrosslinked AGT (15.8 μM). Lane c, AGT (15.8 μM) crosslinked in the absence of DNA for 120 min with formaldehyde (5 mM). Lane d, AGT (15.8 μM) plus 16mer DNA (15.8μM) crosslinked for 120 min with formaldehyde (5 mM). Samples (30 μL) were resolved in a 15% SDS-polyacrylamide gel. Protein bands were detected by silver-staining. Band assignments 1, monomer; 2, dimer based on apparent molecular weight. Panel b: Representative MALDI-mass spectra of trypsin fragments obtained from crosslinked AGT monomer (upper panel) and dimer (lower panel). Protein digestion and mass spectroscopy conditions were as described in Methods.
Figure 5
Figure 5
Proteolytic fragments of AGT assigned to intermolecular crosslinks. Representative fragment-pairs from the ensemble listed in Table III, mapped on the crystal structure of the monomeric AGT-DNA complex determined by Daniels et al.. In each pair the fragment with sequence nearest the N-terminal end of the protein is colored blue, the one nearest the C-terminal end, red. Panel a: Fragments 1-7 and 163-169. Panel b: Fragments 8-19 and 159-167. Panel c: Fragments 22-34 and 159-167. Panel d: Fragments 1-7 and 169-176. Panel e: Fragments 19-32 and 169-176. Panel f: Fragments 19-32 and 105-114. Amino-terminal surfaces are labeled with a blue N, carboxyl-terminal surfaces with a red C.
Figure 6
Figure 6
Analysis of ion-release stoichiometry of AGT binding to DNA. Panel a: Representative electrophoretic mobility shift assays. Binding was carried out at 20 ± 1°C in 10 mM Tris (pH 7.6), 50mM NaCl, 1mM dithiothreitol, and 10 μg/ml bovine serum albumin. Band designations: B, bound DNA; F, free DNA. Upper pane: binding to single-stranded 16mer DNA. Samples contained 5.3 × 10⁻⁷ M DNA (16mer A) and 0–4.9 × 10⁻⁶ M AGT. Lower pane: binding to duplex 16mer. Samples contained 4.8 × 10⁻⁷ M duplex DNA and 0–3.1 × 10⁻⁶ M AGT. Although these images have been cropped for efficient presentation, no additional electrophoretic bands are detectable in the originals. Panel b. Representative Scatchard plots of binding data for single-stranded and duplex DNAs. Data from experiments shown in panel a. Symbols: binding to single stranded DNA (●); binding to duplex DNA (■). The smooth curves are fits of Eq. 1 to these data sets, returning K = 1.69 ± 0.18 × 10⁴ M-1, ω = 151 ± 17 and s = 4.00 ± 0.13 for duplex 16-mer DNA, and K = 1.22 ± 0.19 × 10⁴ M-1, ω = 109 ± 16 and s = 4.03 ± 0.18 for the single-stranded 16-mer. Panel c: Dependence of log Kω on log [NaCl] for single-stranded and duplex DNAs. Binding assays were carried out at 20 ± 1 °C in 10 mM Tris (pH 7.5 at 20°C), 1 mM EDTA, 1mM DTT buffer containing 0.05-0.36M NaCl. Binding was detected by EMSA as shown in panel a and the product K•ω evaluated by Scatchard analysis as shown in panel b. Symbols: (■) data for single-stranded 16 mer DNA, (●), data for duplex 16 mer DNA. The solid lines are fits of the relation log Kω = log K1M − (Δm + Δx) log [MX] to the data, returning values of (Δm + Δx) = 1.74 ± 0.21 and log K1M = 3.86 ± 0.02 for single-stranded DNA and (Δm + Δx) = 1.87 ± 0.17 and log K1M = 3.97± 0.02 for duplex DNA.
Figure 6
Figure 6
Analysis of ion-release stoichiometry of AGT binding to DNA. Panel a: Representative electrophoretic mobility shift assays. Binding was carried out at 20 ± 1°C in 10 mM Tris (pH 7.6), 50mM NaCl, 1mM dithiothreitol, and 10 μg/ml bovine serum albumin. Band designations: B, bound DNA; F, free DNA. Upper pane: binding to single-stranded 16mer DNA. Samples contained 5.3 × 10⁻⁷ M DNA (16mer A) and 0–4.9 × 10⁻⁶ M AGT. Lower pane: binding to duplex 16mer. Samples contained 4.8 × 10⁻⁷ M duplex DNA and 0–3.1 × 10⁻⁶ M AGT. Although these images have been cropped for efficient presentation, no additional electrophoretic bands are detectable in the originals. Panel b. Representative Scatchard plots of binding data for single-stranded and duplex DNAs. Data from experiments shown in panel a. Symbols: binding to single stranded DNA (●); binding to duplex DNA (■). The smooth curves are fits of Eq. 1 to these data sets, returning K = 1.69 ± 0.18 × 10⁴ M-1, ω = 151 ± 17 and s = 4.00 ± 0.13 for duplex 16-mer DNA, and K = 1.22 ± 0.19 × 10⁴ M-1, ω = 109 ± 16 and s = 4.03 ± 0.18 for the single-stranded 16-mer. Panel c: Dependence of log Kω on log [NaCl] for single-stranded and duplex DNAs. Binding assays were carried out at 20 ± 1 °C in 10 mM Tris (pH 7.5 at 20°C), 1 mM EDTA, 1mM DTT buffer containing 0.05-0.36M NaCl. Binding was detected by EMSA as shown in panel a and the product K•ω evaluated by Scatchard analysis as shown in panel b. Symbols: (■) data for single-stranded 16 mer DNA, (●), data for duplex 16 mer DNA. The solid lines are fits of the relation log Kω = log K1M − (Δm + Δx) log [MX] to the data, returning values of (Δm + Δx) = 1.74 ± 0.21 and log K1M = 3.86 ± 0.02 for single-stranded DNA and (Δm + Δx) = 1.87 ± 0.17 and log K1M = 3.97± 0.02 for duplex DNA.
Figure 7
Figure 7
Equilibrium partition of AGT between single stranded and duplex 16mer DNAs. Upper panel: binding detected by mobility shift assay. Binding reactions were carried out at 20 ± 1 °C in 10mM Tris (pH 7.5 at 20°C), 50 mM NaCl, 1mM dithiothreitol, and 10μg/mL bovine serum albumin. Samples contained 4.2 × 10⁻⁷ M of each DNA and 0 - 6.0 × 10⁻⁶ M AGT. Band designations: B, bound DNAs; F, free DNAs. Lower Panel: Dependence of binding ratio Yds/Yss on AGT concentration. As described in Methods, in the limit of low [AGT], Yds/Yss = Kds/Kss. The solid lines are linear fits to the data, returning Kds/Kss = 1.47 ± 0.03.
Figure 7
Figure 7
Equilibrium partition of AGT between single stranded and duplex 16mer DNAs. Upper panel: binding detected by mobility shift assay. Binding reactions were carried out at 20 ± 1 °C in 10mM Tris (pH 7.5 at 20°C), 50 mM NaCl, 1mM dithiothreitol, and 10μg/mL bovine serum albumin. Samples contained 4.2 × 10⁻⁷ M of each DNA and 0 - 6.0 × 10⁻⁶ M AGT. Band designations: B, bound DNAs; F, free DNAs. Lower Panel: Dependence of binding ratio Yds/Yss on AGT concentration. As described in Methods, in the limit of low [AGT], Yds/Yss = Kds/Kss. The solid lines are linear fits to the data, returning Kds/Kss = 1.47 ± 0.03.
Figure 8
Figure 8
Determination of the DNA linking number difference for AGT binding to pUC19 DNA. Panel a: Electrophoretic resolution of topoisomerase I assay samples. Top image: experiment conducted with E. coli topoisomerase I (designated E). Bottom image: experiment conducted with Vaccinia topoisomerase I (designated V). All samples contained closed circular pUC19 DNA (12.0 nM). Samples c-j contained AGT protein at final concentrations of 4.2μM, 8.5μM, 10.9μM, 14.6μM, 18.2μM, 22.5μM, 26.7μM and 36.4μM, respectively. Samples m-t contained AGT protein at final concentrations of 4.2μM, 8.3μM, 15μM, 22μM, 28μM, 36μM, 46μM and 60μM, respectively. Samples b-j were treated with E. coli topoisomerase I (2 units) for 1.5h at 20°C; samples l-t were treated with Vaccinia topoisomerase I (2 units) for 2.5h at 20°C. Samples were split and one half of each sample was deproteinized with phenol and subjected to electrophoresis on a 1.4% agarose gel. The gel was stained with ethidium bromide and photographed digitally with UV transillumination. Panel b: Distribution of ΔLk for samples c-g. Integrated band intensities from the gel shown in (a) were normalized to the highest intensity band in each supercoiled ensemble. The smooth curves are fits of Eq. 6 to this data, allowing the most probable value of the linking difference to be determined for each sample. Panel c: Dependence of binding stoichiometry on free AGT concentration. Stoichiometries were inferred from the weight-average reduced molecular weights of AGT-DNA complexes, measured at sedimentation equilibrium. Black symbols (■,●) represent values of samples taken from topoisomerase reactions shown in panel a, and subjected to analytical ultracentrifugation without further treatment. Grey diamonds (◆) represent data from independent experiments carried out with linear pUC19. Error bars represent 95% confidence limits for the individual parameters. The smooth curve is an isotherm calculated with Eq. 4 using parameters determined from the Scatchard plot shown in the inset. Inset: Scatchard plot for the data ensemble shown in the main panel. The solid curve is a fit of Eq. 4 to the data, returning K = 7,890 ± 1,030 M-1, ω = 51.9 ± 4.2 and s = 6.6 ± 0.2. Panel d: Dependence of the linking difference ΔΔLk on binding stoichiometry, n. Data from the experiments shown in panels a and c. The error bars represent standard errors of the measurement distributions in each dimension. The line is a linear fit to the points; the slope dΔΔLk/dn = -0.020 ± 0.001, equivalent to a net unwinding of 7.31 ± 0.35 deg/protein bound.
Figure 8
Figure 8
Determination of the DNA linking number difference for AGT binding to pUC19 DNA. Panel a: Electrophoretic resolution of topoisomerase I assay samples. Top image: experiment conducted with E. coli topoisomerase I (designated E). Bottom image: experiment conducted with Vaccinia topoisomerase I (designated V). All samples contained closed circular pUC19 DNA (12.0 nM). Samples c-j contained AGT protein at final concentrations of 4.2μM, 8.5μM, 10.9μM, 14.6μM, 18.2μM, 22.5μM, 26.7μM and 36.4μM, respectively. Samples m-t contained AGT protein at final concentrations of 4.2μM, 8.3μM, 15μM, 22μM, 28μM, 36μM, 46μM and 60μM, respectively. Samples b-j were treated with E. coli topoisomerase I (2 units) for 1.5h at 20°C; samples l-t were treated with Vaccinia topoisomerase I (2 units) for 2.5h at 20°C. Samples were split and one half of each sample was deproteinized with phenol and subjected to electrophoresis on a 1.4% agarose gel. The gel was stained with ethidium bromide and photographed digitally with UV transillumination. Panel b: Distribution of ΔLk for samples c-g. Integrated band intensities from the gel shown in (a) were normalized to the highest intensity band in each supercoiled ensemble. The smooth curves are fits of Eq. 6 to this data, allowing the most probable value of the linking difference to be determined for each sample. Panel c: Dependence of binding stoichiometry on free AGT concentration. Stoichiometries were inferred from the weight-average reduced molecular weights of AGT-DNA complexes, measured at sedimentation equilibrium. Black symbols (■,●) represent values of samples taken from topoisomerase reactions shown in panel a, and subjected to analytical ultracentrifugation without further treatment. Grey diamonds (◆) represent data from independent experiments carried out with linear pUC19. Error bars represent 95% confidence limits for the individual parameters. The smooth curve is an isotherm calculated with Eq. 4 using parameters determined from the Scatchard plot shown in the inset. Inset: Scatchard plot for the data ensemble shown in the main panel. The solid curve is a fit of Eq. 4 to the data, returning K = 7,890 ± 1,030 M-1, ω = 51.9 ± 4.2 and s = 6.6 ± 0.2. Panel d: Dependence of the linking difference ΔΔLk on binding stoichiometry, n. Data from the experiments shown in panels a and c. The error bars represent standard errors of the measurement distributions in each dimension. The line is a linear fit to the points; the slope dΔΔLk/dn = -0.020 ± 0.001, equivalent to a net unwinding of 7.31 ± 0.35 deg/protein bound.

References

    1. Loveless A. Possible relevance of O-6 alkylation of dexoyguanosine to the mutagenicity and carcinogenicity of nitrosamines and nitrosamides. Nature (London) 1969;223:206–207. - PubMed
    1. Pegg AE. Mammalian O6-alkylguanine-DNA alkyltransferase: regulation and importance in response to alkylating carcinogens and therapeutic agents. Cancer Res. 1990;50:6119–6129. - PubMed
    1. Margison GP, Santibáñez-Koref MF. O6-Alkylguanine-DNA alkyltransferase: role in carcinogenesis and chemotherapy. BioEssays. 2002;24:255–266. - PubMed
    1. Snow ET, Mitra S. Do carcinogen-modified deoxynucleotide precursors contribute to cellular mutagenesis? Cancer Invest. 1987;5:119–125. - PubMed
    1. Encell LP, Loeb lA. Enhanced in vivo repair of O4-methylthymine by a mutant human DNA alkyltransferase. Carcinogenesis. 2000;21:1397–1402. - PubMed

Publication types

MeSH terms

Substances

LinkOut - more resources