. 2009 Jun;37(11):3588-601.
doi: 10.1093/nar/gkp213. Epub 2009 Apr 9.

Protein-coding gene promoters in Methanocaldococcus (Methanococcus) jannaschii

Affiliations

Protein-coding gene promoters in Methanocaldococcus (Methanococcus) jannaschii

Jian Zhang et al. Nucleic Acids Res. 2009 Jun.

Abstract

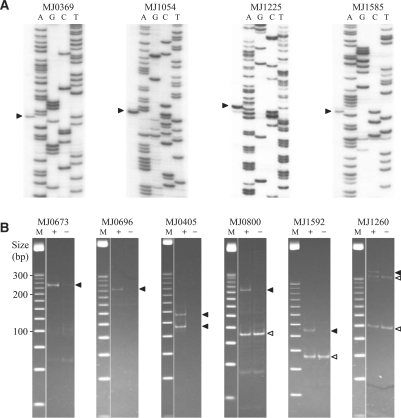
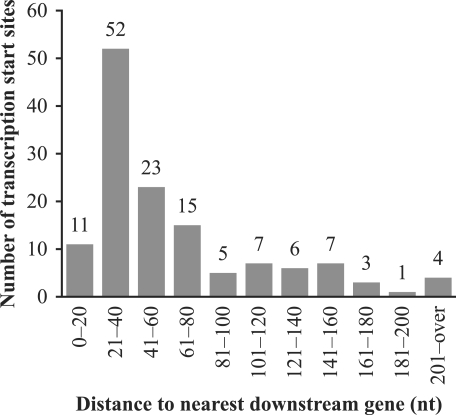
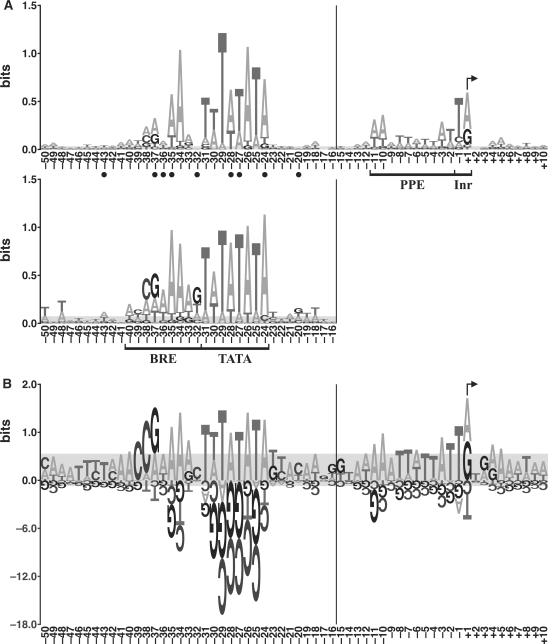
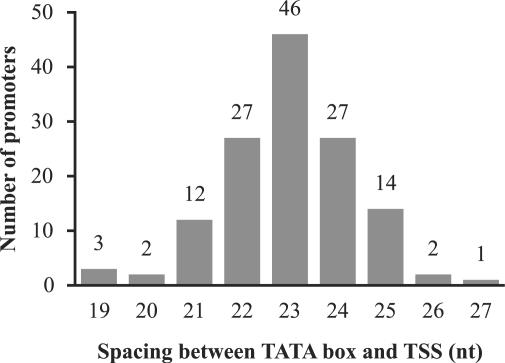
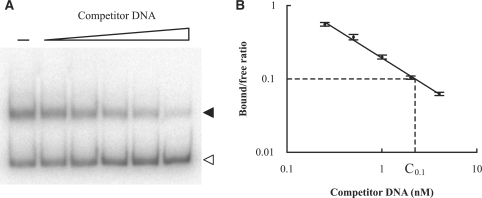
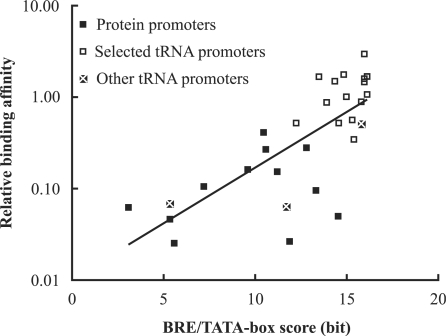
Although Methanocaldococcus (Methanococcus) jannaschii was the first archaeon to have its genome sequenced, little is known about the promoters of its protein-coding genes. To expand our knowledge, we have experimentally identified 131 promoters for 107 protein-coding genes in this genome by mapping their transcription start sites. Compared to previously identified promoters, more than half of which are from genes for stable RNAs, the protein-coding gene promoters are qualitatively similar in overall sequence pattern, but statistically different at several positions due to greater variation among their sequences. Relative binding affinity for general transcription factors was measured for 12 of these promoters by competition electrophoretic mobility shift assays. These promoters bind the factors less tightly than do most tRNA gene promoters. When a position weight matrix (PWM) was constructed from the protein gene promoters, factor binding affinities correlated with corresponding promoter PWM scores. We show that the PWM based on our data more accurately predicts promoters in the genome and transcription start sites than could be done with the previously available data. We also introduce a PWM logo, which visually displays the implications of observing a given base at a position in a sequence.


Figures

Figure 1.
Figure 1.
Mapping TSSs using primer extension and 5′-RACE. (A) Examples of primer extension. Arrowheads indicate runoff transcripts. (B) Examples of 5′-RACE. Each panel is a nondenaturing polyacrylamide gel photographed using Chemi Doc™ System (Bio-Rad). Lanes: M, 25 bp DNA ladder (Promega); +, RT–PCR products from TAP-treated RNA; –, RT–PCR products from untreated RNA (control). Solid arrowheads indicate TSSs. Open arrowheads indicate processing sites.
Figure 2.
Figure 2.
Histogram of distances from the TSSs to their nearest downstream translation start sites. Gene translation start locations were identified initially by the coding region identification tool CRITICA (40), and then curated manually by David E. Graham (University of Texas) using neighboring DNA features and comparative analyses of translation start codons of orthologs in related genomes (personal communication).
Figure 3.
Figure 3.
Logos of promoter sequences. (A) Energy-normalized sequence logos of the protein promoters in this study (top) and the promoters previously identified by the in vitro selection (bottom) (18). The horizontal axis shows nucleotide positions, and the vertical axis is information content in bits (see Materials and Methods section). Promoter elements (BRE, TATA box, PPE and Inr) are bracketed, and the TSS is indicated with a bent arrow. Of the protein promoters in this study, the total information content of BRE is 2.63 bits, TATA box 6.09 bits, PPE 1.84 bits and Inr 1.13 bits. Of the in vitro selected promoters, the total information content of BRE is 4.28 bits, and TATA box 7.05 bits. Closed circles indicate positions at which the protein promoters differ significantly from the in vitro selected promoters (P < 0.05, data from Supplementary Table S3). (B) PWM logo of the protein promoters in this study. The values on the vertical axis are bit scores (which are distinct from bits of information, see Materials and methods section). The vertical scale below the axis is reduced 6-fold relative to that above. Due to the variation in spacing between the TATA box and the TSS, the nucleotide position numbers to the left of the vertical bars in panels A and B are for the most common spacing. In both panels, the gray areas would completely cover 90% of the logos generated from random sets of nucleotides drawn from the genomic base composition, and sample size matched to the number of sequences in the particular logo (i.e. it is a measure of the random background).
Figure 4.
Figure 4.
Histogram of the number of promoters versus the spacers between the 3′ edge of the TATA box and the TSS.
Figure 5.
Figure 5.
Measuring relative binding affinities of promoters for transcription factors TBP and TFBc using competition EMSA. (A) Representative EMSA gel, in which increasing concentrations of competitor DNA (0, 0.25, 0.5, 1, 2 and 4 nM unlabeled M. vannielii tRNAVal promoter) were used to compete the labeled tRNAVal promoter out of the TBP/TFBc/promoter ternary complex. Solid arrowhead, the shifted ternary complex (bound probe); open arrowhead, free probe. (B) Bound to free probe ratios on EMSA gels (as in A) were determined by phosphorimaging. A plot of log(bound/free ratio) versus log(concentration of competitor DNA) was generated, and a good correlation was observed. A reference concentration (C0.1), at which the bound/free ratio was 0.1, was calculated from the regression line.
Figure 6.
Figure 6.
Correlation between promoter BRE/TATA-box score and transcription factor binding. The ‘selected’ tRNA promoters were identified by the in vitro selection (18). The ‘other’ tRNA promoters were identified computationally (32). The vertical position of a point indicates the effectiveness of a promoter, relative to the M. vannielii tRNAVal promoter, in competition for TBP/TFBc. The horizontal position is its BRE/TATA-box score. The correlation coefficient (r) is 0.75, indicating a positive correlation. The equation for the regression line is log2(relative binding affinity) = 0.40 × (BRE/TATA-box score) – 6.60.

References

    1. Soppa J. Basal and regulated transcription in Archaea. Adv. Appl. Microbiol. 2001;50:171–217. - PubMed
    1. Zillig W, Palm P, Langer D, Klenk HP, Lanzendorfer M, Hudepohl U, Hain J. RNA polymerases and transcription in archaebacteria. Biochem. Soc. Symp. 1992;58:79–88. - PubMed
    1. Langer D, Hain J, Thuriaux P, Zillig W. Transcription in Archaea: similarity to that in Eucarya. Proc. Natl Acad. Sci. USA. 1995;92:5768–5772. - PMC - PubMed
    1. Darcy TJ, Hausner W, Awery DE, Edwards AM, Thomm M, Reeve JN. Methanobacterium thermoautotrophicum RNA polymerase and transcription in vitro. J. Bacteriol. 1999;181:4424–4429. - PMC - PubMed
    1. Best AA, Olsen GJ. Similar subunit architecture of archaeal and eukaryal RNA polymerases. FEMS Microbiol. Lett. 2001;195:85–90. - PubMed

Publication types

MeSH terms