. 2009 Jul;150(7):3274-82.
doi: 10.1210/en.2008-1750. Epub 2009 Apr 9.

Subfertile female androgen receptor knockout mice exhibit defects in neuroendocrine signaling, intraovarian function, and uterine development but not uterine function

Affiliations

Subfertile female androgen receptor knockout mice exhibit defects in neuroendocrine signaling, intraovarian function, and uterine development but not uterine function

K A Walters et al. Endocrinology. 2009 Jul.

Abstract

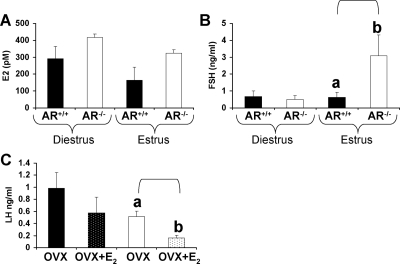
Female androgen receptor (AR) knockout mice (AR(-/-)) generated by an in-frame Ar exon 3 deletion are subfertile, but the mechanism is not clearly defined. To distinguish between extra- and intraovarian defects, reciprocal ovarian transplants were undertaken. Ovariectomized AR(-/-) hosts with wild-type (AR(+/+)) ovary transplants displayed abnormal estrus cycles, with longer cycles (50%, P < 0.05), and 66% were infertile (P < 0.05), whereas AR(+/+) hosts with either AR(-/-) or surgical control AR(+/+) ovary transplants displayed normal estrus cycles and fertility. These data imply a neuroendocrine defect, which is further supported by increased FSH (P <0.05) and estradiol (P <0.05), and greater LH suppressibility by estradiol in AR(-/-) females at estrus (P <0.05). Additional intraovarian defects were observed by the finding that both experimental transplant groups exhibited significantly reduced pups per litter (P < 0.05) and corpora lutea numbers (P < 0.05) compared with surgical controls. All groups exhibited normal uterine and lactation functions. AR(-/-) uteri were morphologically different from AR(+/+) with an increase in horn length (P < 0.01) but a reduction in uterine diameter (P < 0.05), total uterine area (P < 0.05), endometrial area (P < 0.05), and myometrial area (P < 0.01) at diestrus, indicating a role for AR in uterine growth and development. Both experimental transplant groups displayed a significant reduction in uterine diameter (P < 0.01) compared with transplanted wild-type controls, indicating a role for both AR-mediated intraovarian and intrauterine influences on uterine physiology. In conclusion, these data provide direct evidence that extraovarian neuroendocrine, but not uterine effects, as well as local intraovarian AR-mediated actions are important in maintaining female fertility, and a disruption of AR signaling leads to altered uterine development.


Figures

Figure 1
Figure 1
Estrus cycling and fertility. A and E, AR+/+, black bars; AR+/−, gray bars; and AR−/−, white bars. B, F, G, and H, MAR+/+OvAR+/+, black with white dots; MAR+/+OvAR−/−, black with white horizontal lines; MAR−/−OvAR+/+, white with black diagonal lines. C, AR+/+, black square; AR+/−, gray diamond; and AR−/−, white circle. D and I, MAR+/+OvAR+/+, gray square; MAR+/+OvAR−/−, black triangle; MAR−/−OvAR+/+, white triangle. A and B, Percentage of females to cycle. C and D, Percentage of females to complete one cycle and median time in days for mice to complete one cycle (P < 0.05). E and F, Average number of cycles in 2 wk (P < 0.01). G, Percentage of females to undergo a successful pregnancy (P < 0.05). H, Average number of litters per female over a 3-month breeding period (P < 0.05). I, Average cumulative number of pups per month over a 3-month period of continual mating (P < 0.01). Data are the mean ± sem (n ≥ 8/genotype). Different superscript letters denote statistically significant differences.
Figure 2
Figure 2
Ovary weights and average number of CL per ovary. MAR+/+OvAR+/+, black with white dots; MAR+/+OvAR−/−, black with white horizontal lines; MAR−/−OvAR+/+, white with black diagonal lines. A, Ovary weights (P < 0.01). B, Average number of CL per ovary at the diestrus stage (P < 0.05). All data are expressed as the mean ± sem (n ≥ 6/genotype). Different superscript letters denote statistically significant differences. C, Histological ovarian sections from ovary transplant groups. CL are indicated by an asterisk.
Figure 3
Figure 3
Hormone levels in intact and OVX mice with and without E2 treatment. AR+/+, black bars; AR−/−, white bars. E2 (A) and FSH (B) levels (P < 0.05) at the diestrus and estrus stage in 12-wk-old females (n = 6/genotype). C, OVX AR+/+, black bars; OVX AR−/−, white bars; OVX AR+/++E2, black with white dots; AR−/−+E2, white with black dots. LH levels in AR+/+ and AR−/− (P < 0.01) OVX mice with and without E2 treatment are shown (n = 8/genotype). All data are expressed as the mean ± sem. Different superscript letters denote statistically significant differences.
Figure 4
Figure 4
Confirmation of the deletion of AR exon 3 in the uterus, and uterine weights, horn length, and diameter. AR+/+, black bars; AR−/−, white bars; MAR+/+OvAR+/+, black with white dots; MAR+/+OvAR−/−, black with white horizontal lines; MAR−/−OvAR+/+, white with black diagonal lines. A, Schematic diagram of intact and excised AR exon 3, showing location of primer pairs used for PCR genotype identification from RNA. B, Representation of RT-PCR analyses using cDNA from uteri of 8-wk-old mice, to confirm that uteri from AR−/− females carried the global exon 3 deleted transcripts. Intact AR exon 3 product is 288 bp and excised AR exon 3 product is 171 bp. Mouse β-actin, used as an internal control, had a product of 431 bp. C and G, Uterus weights. Data are the mean ± sem n = 5/genotype. D, Uteri (U) and ovaries (O) from 8-wk AR+/+ and AR−/− females at diestrus. E and H, Uterine horn length of AR+/+ and AR−/−females at diestrus (P < 0.01) and estrus (P < 0.01) and ovary transplant groups at diestrus (P < 0.01). Data are the mean ± sem (n = 3–5/genotype). F and I, Uterine diameter of AR+/+ and AR−/− females at diestrus (P < 0.01) and estrus (P < 0.05) and ovary transplant groups at diestrus (P < 0.01). Data are the mean ± sem n = 5/genotype. Different superscript letters denote statistically significant differences.
Figure 5
Figure 5
Morphology of the uterus. AR+/+, black bars; AR−/−, white bars; MAR+/+OvAR+/+, black with white dots; MAR+/+OvAR−/−, black with white horizontal lines; MAR−/−OvAR+/+, white with black diagonal lines. A and E, Average total uterine area of AR+/+ and AR−/− females at diestrus (P < 0.01) and estrus (P < 0.05) and ovary transplants groups at diestrus (P < 0.01). B and F, Average endometrial area of AR+/+ and AR−/− females at diestrus (P < 0.05) and estrus (P = 0.08) and ovary transplants groups at diestrus (P < 0.01). C and G, Average myometrial area of AR+/+ and AR−/− females at diestrus (P < 0.01) and estrus (P < 0.01) and ovary transplants groups at diestrus (P < 0.01). D and H, Average luminal epithelial cell height of AR+/+ and AR−/− females at diestrus and estrus and ovary transplants groups at diestrus. Data are the mean ± sem (n = 5/genotype). Different superscript letters denote statistically significant differences.
Figure 6
Figure 6
Uterine reproductive function. AR+/+, black bars; AR−/−, white bars. A, Average number of CL (P < 0.01). B, Average number of implantation sites (P < 0.01). C, Average number of fetuses in utero (P < 0.05). D, Percentage of preimplantation losses. E, Percentage of postimplantation losses. F, Average gestation length. G, P4 levels at d 16 of gestation (P < 0.01). H, E2 levels at d 16 of gestation. Data are the mean ± sem (n ≥ 5/genotype). Different superscript letters denote statistically significant differences.

References

    1. Lubahn DB, Joseph DR, Sullivan PM, Willard HF, French FS, Wilson EM 1988 Cloning of human androgen receptor complementary DNA and localization to the X chromosome. Science 240:327–330 - PubMed
    1. Hillier SG, Whitelaw PF, Smyth CD 1994 Follicular oestrogen synthesis: the ‘two-cell, two-gonadotrophin’ model revisited. Mol Cell Endocrinol 100:51–54 - PubMed
    1. Walters KA, Allan CM, Jimenez M, Lim PR, Davey RA, Zajac JD, Illingworth P, Handelsman DJ 2007 Female mice haploinsufficient for an inactivated androgen receptor (AR) exhibit age-dependent defects that resemble the AR null phenotype of dysfunctional late follicle development, ovulation, and fertility. Endocrinology 148:3674–3684 - PubMed
    1. Shiina H, Matsumoto T, Sato T, Igarashi K, Miyamoto J, Takemasa S, Sakari M, Takada I, Nakamura T, Metzger D, Chambon P, Kanno J, Yoshikawa H, Kato S 2006 Premature ovarian failure in androgen receptor-deficient mice. Proc Natl Acad Sci USA 103:224–229 - PMC - PubMed
    1. Hu YC, Wang PH, Yeh S, Wang RS, Xie C, Xu Q, Zhou X, Chao HT, Tsai MY, Chang C 2004 Subfertility and defective folliculogenesis in female mice lacking androgen receptor. Proc Natl Acad Sci USA 101:11209–11214 - PMC - PubMed

Publication types

MeSH terms