. 2009 Jun 4;113(23):5765-75.
doi: 10.1182/blood-2009-01-198374. Epub 2009 Apr 9.

Probing the mitotic history and developmental stage of hematopoietic cells using single telomere length analysis (STELA)

Affiliations

Probing the mitotic history and developmental stage of hematopoietic cells using single telomere length analysis (STELA)

Mark Hills et al. Blood. .

Abstract

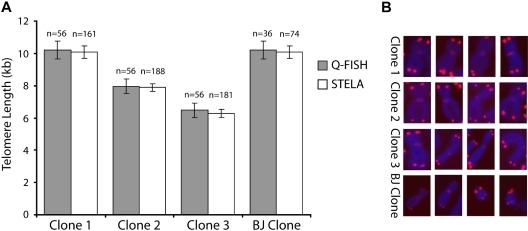
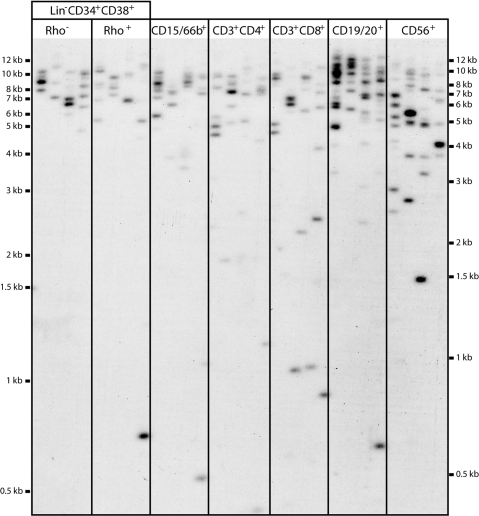
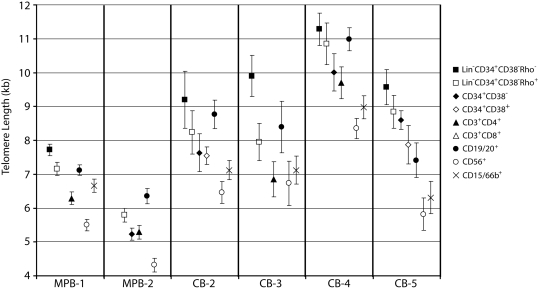
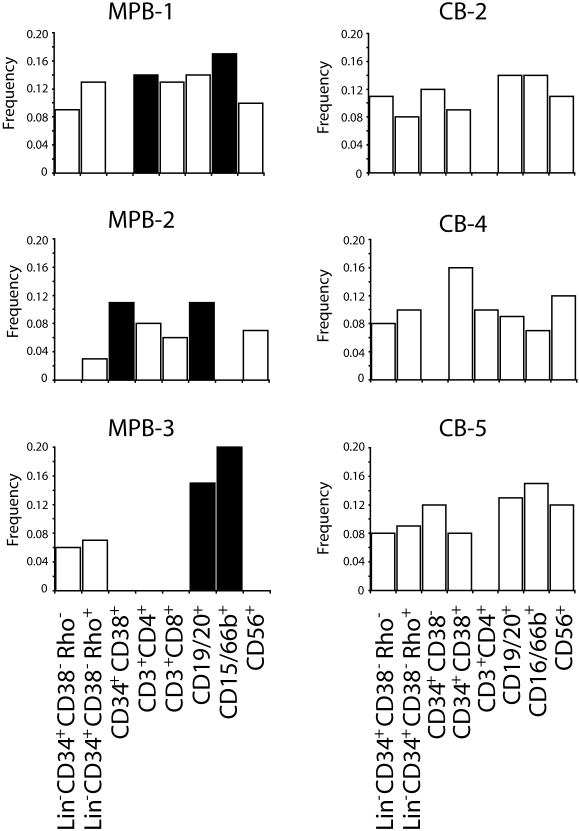
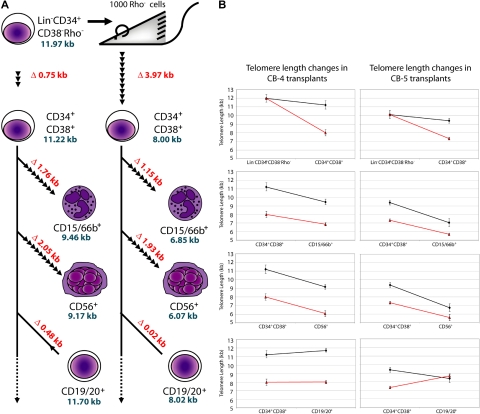
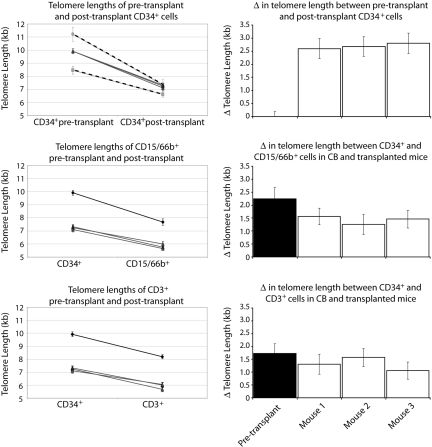
In most human somatic cells, telomeres shorten as a function of DNA replication. Telomere length is therefore an indirect measure of the replicative history of cells. We measured the telomere lengths at XpYp chromosomes in purified human hematopoietic populations enriched for stem cells (Lin(-)CD34(+)CD38(-)Rho(-)) and successively more mature cells. The average telomere length showed expected length changes, pointing to the utility of this method for classifying novel differentiation markers. Interestingly, the frequency of abruptly shortened telomeres increased in terminally differentiated adult populations, suggesting that damage to telomeric DNA occurs or is not repaired upon hematopoietic differentiation. When Lin(-)CD34(+)CD38(-)Rho(-) cord blood cells were transplanted into immunodeficient mice, the telomeres of the most primitive regenerated human hematopoietic cells lost approximately 3 kb, indicative of more than 30 cell divisions. Further losses in differentiating cells were similar to those observed in pretransplantation cell populations. These results indicate extensive self-renewal divisions of human hematopoietic stem cells are the primary cause of telomere erosion upon transplantation rather than added cell divisions in downstream progenitors.


Figures

Figure 1
Figure 1
Comparison between STELA and Q-FISH. (A) Telomere lengths were determined in 4 cloned fibroblast lines by STELA and Q-FISH. The graph shows mean telomere length (± SEM) for both techniques. (B) Representative Q-FISH images of the allosomes in each clone analyzed. The X chromosome was identified with the addition of an X-specific centromeric PNA probe, whereas the Y chromosome (BJ clone only) was identified by G-banding patterns.
Figure 2
Figure 2
Representative STELA blot. DNA extracted from sorted subpopulations of cells was taken through STELA PCR to amplify XpYp telomeres. An estimated concentration of 50 amplifiable molecules was added to each master mix, and aliquoted into 5 separate PCR tubes to ensure clear identification of resolved products. Amplicons were resolved on 0.7% agarose, Southern blotted, and detected with an XpYp-specific probe. Each amplicon represents the product from a single telomere end from a single cell, allowing telomere measurements of highly limiting cell populations. Amplicons were binned into size windows to determine mean telomere lengths, and products falling outside 1.4826 MAD from the median were counted and classified as ultrashort “outlier” telomeres.
Figure 3
Figure 3
Mean telomere lengths in subpopulations of MPB and CB. Representative MPB and CB samples are shown with mean telomere lengths (± SEM) in all analyzed subpopulations. Primitive subpopulations show the longest mean telomere lengths within each sample. Of the terminally differentiated cell types, CD56+ cells routinely have the shortest telomeres. CD19/20+ cells have the longest mean telomere length of terminally differentiated cells, predominantly due to a subset of cells having very long telomeres. This has been observed elsewhere and is presumably due to the reactivation of telomerase during B-cell development. Full telomere length data and distribution from all samples analyzed are presented in Figure S1 (available on the Blood website; see the Supplemental Materials link at the top of the online article).
Figure 4
Figure 4
Frequency of ultrashort telomeres in subpopulations of hematopoietic cells. Bar graphs show the frequency of statistical outliers within each sorted subpopulation. Where no bar is shown, no telomere data exist for that particular subpopulation. The frequency of statistical outliers in more differentiated cells was compared with the most primitive cells available for each sample. Linear regression analyses were performed to identify significant increases in ultrashort telomeres, with significant subpopulations denoted as ■. MPB subpopulations showed significant increases in ultrashort telomeres with respect to more primitive cells; however, this trend was not observed in CB samples. An additional 2 CBs were analyzed and also showed no significant increases in ultrashort telomeres (data not shown).
Figure 5
Figure 5
Telomere length changes in donor cells after transplantation of purified human CB cells into immune-deficient mice. (A) Schematic for transplantation, sorting, and STELA analysis is shown on the left panel. LinCD34+CD38Rho cells were transplanted into mice, and differentiated cell types were sorted 6 weeks after transplantation. STELA analysis was then performed and telomere lengths were compared. Differences in telomere lengths between differentiated and progenitor cell types in CB-4 are shown as kilobases, in red, whereas telomere lengths (excluding outliers) are shown in blue. The number of cell divisions between differentiated and progenitor cells are represented by arrowheads, each representing 2.5 cell divisions (assuming ∼ 100 bp loss per cell division). (B) Graphs showing the difference between telomere lengths from progenitor to daughter cells before and after transplantation in CB-4 and CB-5. Note the large decrease in telomere length from the LinCD34+CD38Rho to the CD34+CD38 populations in both transplants with respect to pretransplantation telomere loss.
Figure 6
Figure 6
Results from a single CB transplanted into 3 mice. Top graph shows the comparison between 3 mice that each received a transplant of 3% of whole CB-6 (gray lines), and the 2 separate CB transplantation experiments (CB-4 and CB-5; dashed lines). Although the independent transplantation experiments yield differing degrees of telomere loss after transplantation, the mice that received a transplant within the same experiment with the same CB show indistinguishable telomere loss. Subsequent graphs compare the telomere length of primitive CD34+ cells with terminally differentiated CD15/66b+ or CD3+ cells before and after transplantation (black and gray lines, respectively), and show similar changes in telomere length in the 3 mice that received a transplant of the same CB. Right panel shows the degree of telomere loss between pretransplantation and posttransplantation CD34+ cells (top bar chart), and the degree of telomere loss between CD34+ and differentiated cells in untransplanted CB, and the 3 mice that underwent transplantation (subsequent bar charts).

References

    1. Moyzis RK, Buckingham JM, Cram LS, et al. A highly conserved repetitive DNA sequence, (TTAGGG)n, present at the telomeres of human chromosomes. Proc Natl Acad Sci U S A. 1988;85:6622–6626. - PMC - PubMed
    1. de Lange T. Shelterin: the protein complex that shapes and safeguards human telomeres. Genes Dev. 2005;19:2100–2110. - PubMed
    1. Makarov VL, Hirose Y, Langmore JP. Long G tails at both ends of human chromosomes suggest a C strand degradation mechanism for telomere shortening. Cell. 1997;88:657–666. - PubMed
    1. McEachern MJ, Krauskopf A, Blackburn EH. Telomeres and their control. Annu Rev Genet. 2000;34:331–358. - PubMed
    1. Blackburn EH. Structure and function of telomeres. Nature. 1991;350:569–573. - PubMed

Publication types