. 2009 Apr 28;106(17):7131-6.
doi: 10.1073/pnas.0902232106. Epub 2009 Apr 9.

Association of survival and disease progression with chromosomal instability: a genomic exploration of colorectal cancer

Affiliations

Association of survival and disease progression with chromosomal instability: a genomic exploration of colorectal cancer

Michal Sheffer et al. Proc Natl Acad Sci U S A. .

Abstract

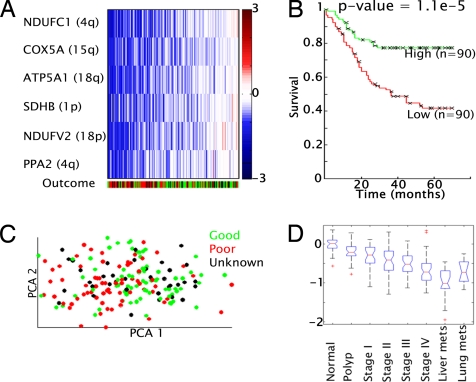
During disease progression the cells that comprise solid malignancies undergo significant changes in gene copy number and chromosome structure. Colorectal cancer provides an excellent model to study this process. To indentify and characterize chromosomal abnormalities in colorectal cancer, we performed a statistical analysis of 299 expression and 130 SNP arrays profiled at different stages of the disease, including normal tissue, adenoma, stages 1-4 adenocarcinoma, and metastasis. We identified broad (> 1/2 chromosomal arm) and focal (< 1/2 chromosomal arm) events. Broad amplifications were noted on chromosomes 7, 8q, 13q, 20, and X and broad deletions on chromosomes 4, 8p, 14q, 15q, 17p, 18, 20p, and 22q. Focal events (gains or losses) were identified in regions containing known cancer pathway genes, such as VEGFA, MYC, MET, FGF6, FGF23, LYN, MMP9, MYBL2, AURKA, UBE2C, and PTEN. Other focal events encompassed potential new candidate tumor suppressors (losses) and oncogenes (gains), including CCDC68, CSMD1, POLR1D, and PMEPA1. From the expression data, we identified genes whose expression levels reflected their copy number changes and used this relationship to impute copy number changes to samples without accompanying SNP data. This analysis provided the statistical power to show that deletions of 8p, 4p, and 15q are associated with survival and disease progression, and that samples with simultaneous deletions in 18q, 8p, 4p, and 15q have a particularly poor prognosis. Annotation analysis reveals that the oxidative phosphorylation pathway shows a strong tendency for decreased expression in the samples characterized by poor prognosis.


Conflict of interest statement

The authors declare no conflict of interest.

Figures

Fig. 1.
Fig. 1.
Chromosomal instabilities in colon cancer. (A) Rows represent SNPs and columns represent samples. The colored entries represent the level of copy number changes with amplifications in red and deletions in blue. The values are the smoothed log-copy number ratios CRn,s (see Methods). The color bar at the Top of the figure identifies normal tissue (blue), neareuploid tumors (green), and aneuploid tumors (red). (B) The CINons found by the GISTIC method (configuration 1): the Left plot (blue trace) shows the −log(q-values) for deletions and the Right plot (red trace) shows the −log(q-values) for amplification (the x axis was scaled for visualization purposes). The CINons marked with green * are focal; the remaining are broad (see Methods). The dotted line separates the p and q arms of the chromosome. (C) Same as b for configuration 2 (see Methods and SI Methods).
Fig. 2.
Fig. 2.
CINon copy number tables, from SNP and expression. (A) Copy number table of the broad CINons (including the focal CINon 1p) as obtained from SNP data, for 55 aneuploid tumors; each row represents a broad CINon and each column a sample. An entry is calculated as the median of CRn,s: the SNPs within the CINon, in the corresponding sample (see color bar to Right of figure). (B) CINon expression table, for 256 adenomas and tumors, similar to the copy number table (A). The entries were calculated as the median of the “correlated genes” of the CINon (see text and Methods). In both a and b the samples are divided into 4 groups as shown in the second color bar at the Bottom (in the text); the first color bar represents the tissue origin of the sample where primary tumor is blue, MIN tumor is yellow, adenoma is green, sample from liver metastasis is red, and sample from lung metastasis is black; in the third color bar the stage 4 tumors (primary samples presenting with metastasis) are in red; the fourth color bar represents outcome, where adenomas are in blue, good outcome samples in green, poor outcome in red, and unknown outcome in black. (C and D) Kaplan-Meier plot of primary tumor samples that belong to groups A + B (green) versus group C (red) of copy numbers and expression, respectively. Follow-up intervals that were greater than 70 months were assigned 70.
Fig. 3.
Fig. 3.
The oxidative phosphorylation pathway. (A) Expression matrix of 6 genes belonging to the oxidative phosphorylation pathway, which were downregulated in poor outcome tumors. Primary tumor samples were ordered using SPIN (37), colored according to their outcome status; green represents good outcome, red poor outcome, and black represents unknown outcome. (B) Kaplan-Meier plot of 2 equal-sized groups of samples, partitioned according to the ordering in a. Follow-up intervals that were greater than 70 months were assigned 70. (C) First and second PCA plot of the primary tumor samples in the space of the 6 genes shown in A, using the same coloring. (D) Box plot of the mean log fold-change expression values of the 6 genes, grouped according to disease stages.

References

    1. Fearon ER, Vogelstein B. A genetic model for colorectal tumorigenesis. Cell. 1990;61:759–767. - PubMed
    1. Lengauer C, Kinzler KW, Vogelstein B. Genetic instabilities in human cancers. Nature. 1998;396:643–649. - PubMed
    1. Jones AM, et al. Array-CGH analysis of microsatellite-stable, near-diploid bowel cancers and comparison with other types of colorectal carcinoma. Oncogene. 2005;24:118–129. - PubMed
    1. Kurashina K, et al. Chromosome copy number analysis in screening for prognosis-related genomic regions in colorectal carcinoma. Cancer Sci. 2008;99:1835–1840. - PMC - PubMed
    1. Leslie A, et al. Mutations of APC, K-ras, and p53 are associated with specific chromosomal aberrations in colorectal adenocarcinomas. Cancer Res. 2003;63:4656–4661. - PubMed

Publication types