. 2009 May;174(5):1725-34.
doi: 10.2353/ajpath.2009.080241. Epub 2009 Apr 9.

CCN3 (NOV) is a negative regulator of CCN2 (CTGF) and a novel endogenous inhibitor of the fibrotic pathway in an in vitro model of renal disease

Affiliations

CCN3 (NOV) is a negative regulator of CCN2 (CTGF) and a novel endogenous inhibitor of the fibrotic pathway in an in vitro model of renal disease

Bruce L Riser et al. Am J Pathol. 2009 May.

Abstract

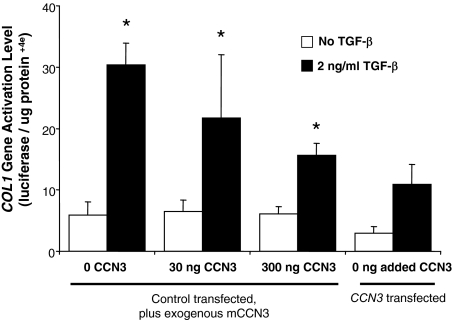
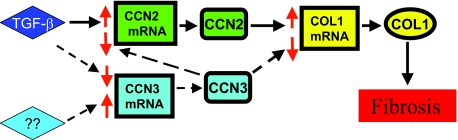
Fibrosis is a major cause of end-stage renal disease, and although initiation factors have been elucidated, uncertainty concerning the downstream pathways has hampered the development of anti-fibrotic therapies. CCN2 (CTGF) functions downstream of transforming growth factor (TGF)-beta, driving increased extracellular matrix (ECM) accumulation and fibrosis. We examined the possibility that CCN3 (NOV), another CCN family member with reported biological activities that differ from CCN2, might act as an endogenous negative regulator of ECM and fibrosis. We show that cultured rat mesangial cells express CCN3 mRNA and protein, and that TGF-beta treatment reduced CCN3 expression levels while increasing CCN2 and collagen type I activities. Conversely, either the addition of CCN3 or CCN3 overexpression produced a marked down-regulation of CCN2 followed by virtual blockade of both collagen type I transcription and its accumulation. This finding occurred in both growth-arrested and CCN3-transfected cells under normal growth conditions after TGF-beta treatment. These effects were not attributable to altered cellular proliferation as determined by cell cycle analysis, nor were they attributable to interference of Smad signaling as shown by analysis of phosphorylated Smad3 levels. In conclusion, both CCN2 and CCN3 appear to act in a yin/yang manner to regulate ECM metabolism. CCN3, acting downstream of TGF-beta to block CCN2 and the up-regulation of ECM, may therefore serve to naturally limit fibrosis in vivo and provide opportunities for novel, endogenous-based therapeutic treatments.


Figures

Figure 1
Figure 1
Exogenous CCN3 treatment down-regulates MC CCN2 and COL1 protein and COL1 promoter activity. Secretion of CCN2 (A) or COL1 (B) per cell in response to conditioned medium (cond)-CCN3 or purified rmCCN3 as quantified by ELISA. *P < 0.05 versus TGF-β; **P < 0.05 versus control. Box shows the range, the dot the average, and the line the median of values. The amount of CCN3 in the conditioned medium from NCI-H295R cells was predetermined by ELISA. C: Activation of COL1 promoter as measured by luciferase activity, in response to rhCCN3 at the times indicated after transfection. Each bar represents an individual treatment under the conditions indicated. The experiment was repeated with very similar results. A: The low baseline CCN2 secretion was markedly increased by TGF-β exposure and both unpCCN3 (cond. NCI) and rmNOV blocked CCN2 production in a dose-dependent manner. B: A similar effect was seen on COL1 levels. C: COL1 promoter activity was the strongest 48 hours after transfection and was greatly inhibited by CCN3.
Figure 2
Figure 2
The inhibitory effects of CCN3 on TGF-β stimulation of CCN2 and COL I localization in MCs are illustrated using immunocytochemistry. Immunocytochemical staining of CCN2 and COL I was performed on cultured rat MCs, in the absence or presence of exogenously administered cytokines. Representative fields show that treatment with TGF-β alone (5 ng/ml) caused localization of CCN2 to change from a primarily peripheral localization (A) to a more homogenous pattern (B) throughout the cytoplasm. C: Treatment with both TGF-β (5 ng/ml) and rmCCN3 (500 ng/ml) prevented this change from occurring. Similarly, TGF-β alone (5 ng/ml) caused localization of COL I to change from a primarily peripheral localization (D) to a more homogenous cytoplasmic distribution with concentration in the perinuclear area (E). F: As with CCN2, addition of both TGF-β (5 ng/ml) and rmCCN3 (500 ng/ml) prevented this change from occurring for collagen I.
Figure 3
Figure 3
Expression and negative regulation of CCN3 in MCs by TGF-β. A: RT-PCR results for the indicated mRNA species run from the same set of three MC cultures in the presence or absence of TGF-β1 (2 ng/ml). Molecular weight markers are shown in the left lane. B: CCN3 protein secretion per cell in control and TGF-β-treated cultures after 96 hours. Shown are average ± SEM. *P < 0.05 versus control. Untreated MCs in culture gave low levels of CCN2 and COL1 mRNA and protein and high levels of CCN3 mRNA and protein. Exposure to TGF-β increased CCN2 and COL1 activity while simultaneously decreasing CCN3 activity. The experiment was repeated with similar results.
Figure 4
Figure 4
The converse effects of TGF-β on CCN2 and CCN3 localization in MCs are illustrated using immunocytochemistry. Immunocytochemical staining of CCN2 or CCN3 was performed on cultured rat MCs, in the absence and presence of TGF-β (5 ng/ml). Representative fields show that CCN2 accumulates as dense deposits in the peripheral regions of the cells without TGF-β stimulation (A), but appears to redistribute throughout the cytoplasm in response to TGF-β (B). Conversely, CCN3 is homogenously distributed throughout the cytoplasm in the absence of TGF-β (C), but accumulates as dense deposits in the cell periphery when treated with TGF-β (D).
Figure 5
Figure 5
Targeted expression of hCCN3 reduces CCN2 and blocks COL1 activity in rat MCs. A: Results of RT-PCR on mRNA levels from rat MCs transfected with the human CCN3 gene versus control (empty vector) transfected cells. Results are from the same MC lines analyzed by ELISA for CCN3 (B), CCN2 (C), or COL1 (D) proteins produced. Human CCN3 transfection resulted in a high level of human CCN3 mRNA expression and secreted protein. This transfection of CCN3 significantly decreased CCN2 secretion and blocked COL1 production. Cell counts at the time of these measurements showed no significant affect of transfection on cell replication (not shown).
Figure 6
Figure 6
Comparison of exogenous versus endogenous CCN3 on COL1 promoter activity. Control, empty vector, transiently transfected MCs were exposed to rmCCN3 at the indicated concentrations. hCCN3-transfected MCs received no added CCN3. COL1 activation was measured by luciferase production. *P < 0.05 compared with no added CCN3 (control-transfected). In the absence of TGF-β stimulation there was little activation of the COL1 promoter and no effect of CCN3 except a slight reduction in cells transfected with CCN3 (white bars). With TGF-β treatment (2 ng/ml, black bars) the COL1 promoter was strongly activated and was markedly reduced by either increased endogenous or exogenous CCN3.
Figure 7
Figure 7
Transfection and overexpression of CCN3 does not affect cell cycling under the conditions tested. The number of cells for a given cell-cycle phase (labeled) is plotted in rat MCs that have either been transfected with an empty vector (A, control) or the gene for CCN3 (B, transfected) in representative experiments. Flow cytometric analysis of cellular DNA was conducted after 2 days of incubation with media containing 10% serum. Both plots are similar, indicating that transfection with the CCN3 gene causes little or no change in cell cycling. This is confirmed in C, in which the percentage of total cells is plotted for each cycle from three separate experiments. The profiles for control and CCN3-transfected cells at each cell-cycle phase are not significantly different, as determined by a group t-test.
Figure 8
Figure 8
Treatment of MCs with exogenous CCN3 does not alter cell cycling. The number of cells for a given cell-cycle phase (labeled) is plotted in cultured rat MCs from representative experiments under varying conditions as follows: control untreated cells (A), cells treated exogenously with TGF-β1 (3 ng/ml) (B), cells given CCN3 (300 ng/ml) (C), cells exposed to both CCN3 (300 ng/ml) and TGF-β (3 ng/ml) (D). Cells were first cultured in a medium containing 10% serum for 2 days, then replaced with fresh medium containing 2% serum for 1 day, before adding the exogenous cytokines indicated above. Flow cytometric analysis of cellular DNA was performed after 2 additional days of culture with the cytokines. All of the plots are similar, indicating that treatment with TGF-β and/or CCN3 did not affect the cell cycle in these cells, under the experimental conditions. This is confirmed in E, in which the percentage of total cells at each cell-cycle phase is quantified from three separate experiments. The profiles for the G0G1 and S phases are unchanged by the various treatments, as determined by analysis of variance, using a Tukey posthoc analysis.
Figure 9
Figure 9
Phosphorylation of pSmad3 in cultured rat MCs is not altered by CCN3. Both CCN3 transfected (A) and exogenously treated (B) cells are shown. Cells were first cultured in a medium containing 10% FBS for 2 days, after which the medium was exchanged to one containing 2% serum for 1 day. Transfected cells were incubated for another 2 days before analysis. For the exogenously treated cells, recombinant CCN3 (300 ng/ml) was added to the plates indicated above, and both treated and untreated plates were incubated for an additional 2 days. Before harvesting the cells, the plates indicated above were treated with TGF-β (3 ng/ml), and all plates were incubated for another hour. Nuclear extracts were then prepared for immunoblotting. Results in A are duplicate samples from two different sets of cultures, and B is a single sample from combined cultures. The experiments were both repeated with very similar results. The data indicate that TGF-β increases phosphorylation of pSmad3 in rat MCs under the experimental conditions used, and that CCN3 does not affect its phosphorylation.
Figure 10
Figure 10
Hypothesis for the regulation, by CCN3, of CCN2 and collagen in fibrosis. Solid arrows show the current paradigm for up-regulation of ECM accumulation and fibrosis by TGF-β and CCN2. Dashed arrows show the pathway identified in the present work. Red arrows depict the effect (positive or negative) of the molecule on the further downstream elements. Currently unknown are factors that may induce endogenous CCN3 in renal disease or fibrosis.

References

    1. Brigstock DR, Goldschmeding R, Katsube KI, Lam SC, Lau LF, Lyons K, Naus C, Perbal B, Riser B, Takigawa M, Yeger H. Proposal for a unified CCN nomenclature. Mol Pathol. 2003;56:127–128. - PMC - PubMed
    1. Perbal B. CCN proteins: multifunctional signalling regulators. Lancet. 2004;363:62–64. - PubMed
    1. Perbal B. The CCN family of genes: a brief history. Mol Pathol. 2001;54:103–104. - PMC - PubMed
    1. Rachfal AW, Brigstock DR. Structural and functional properties of CCN proteins. Vitam Horm. 2005;70:69–103. - PubMed
    1. Riser BL, Denichilo M, Cortes P, Baker C, Grondin JM, Yee J, Narins RG. Regulation of connective tissue growth factor activity in cultured rat mesangial cells and its expression in experimental diabetic glomerulosclerosis. J Am Soc Nephrol. 2000;11:25–38. - PubMed

Publication types

MeSH terms