

INSIG2 SNPs associated with obesity and glucose homeostasis traits in Hispanics: the IRAS Family Study
- PMID: 19360016
- PMCID: PMC2916685
- DOI: 10.1038/oby.2009.94
INSIG2 SNPs associated with obesity and glucose homeostasis traits in Hispanics: the IRAS Family Study
Abstract
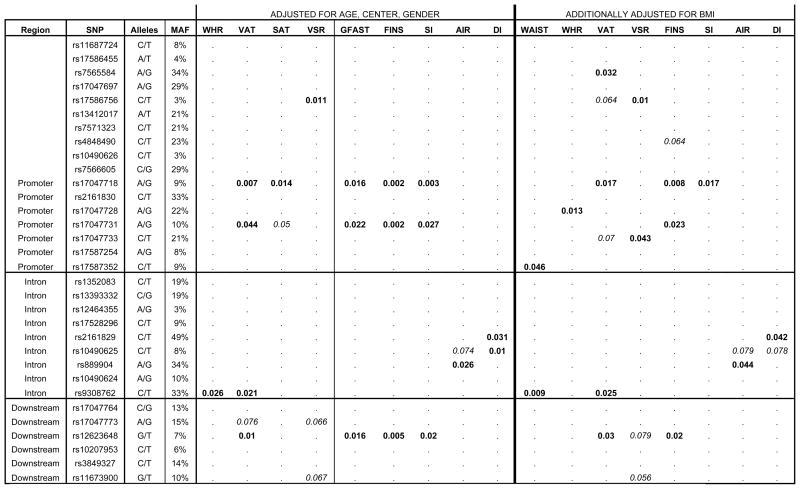
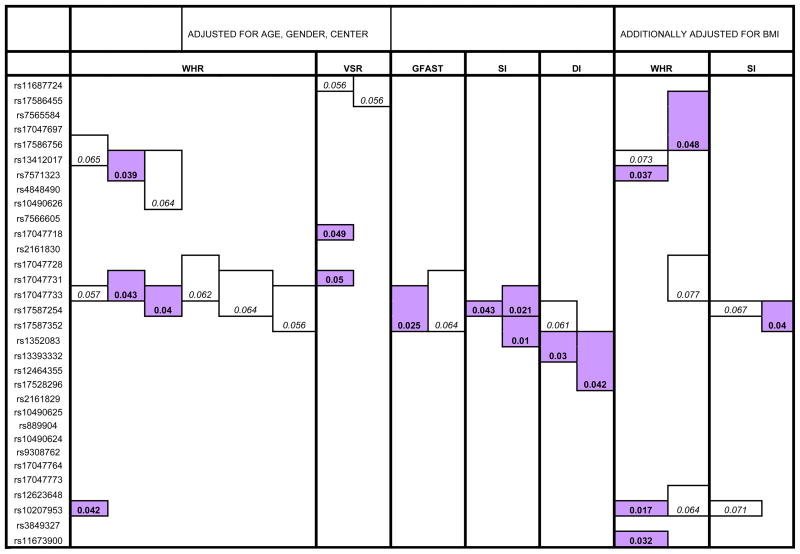
The genome-wide association study by Herbert et al. identified the INSIG2 single-nucleotide polymorphism (SNP) rs7566605 as contributing to increased BMI in ethnically distinct cohorts. The present study sought to further clarify the matter, by testing whether SNPs of INSIG2 influenced quantitative adiposity or glucose homeostasis traits in Hispanics of the Insulin Resistance Atherosclerosis Family Study (IRASFS). Using a tagging SNP approach, rs7566605 and 31 additional SNPs were genotyped in 1,425 IRASFS Hispanics. SNPs were tested for association with six adiposity measures: BMI, waist circumference (WAIST), waist-to-hip ratio (WHR), subcutaneous adipose tissue (SAT), visceral adipose tissue (VAT), and VAT to SAT ratio (VSR). SNPs were also tested for association with fasting glucose (GFAST), fasting insulin (FINS), and three measures obtained from the frequently sampled intravenous glucose tolerance test: insulin sensitivity (S(I)), acute insulin response (AIR), and disposition index (DI). Most prominent association was observed with direct computed tomography (CT)-measured adiposity phenotypes, including VAT, SAT, and VSR (P values range from 0.007 to 0.044 for rs17586756, rs17047718, rs17047731, rs9308762, rs12623648, and rs11673900). Multiple SNP associations were observed with all glucose homeostasis traits (P values range from 0.001 to 0.031 for rs17047718, rs17047731, rs2161829, rs10490625, rs889904, and rs12623648). Using BMI as a covariate in evaluation of glucose homeostasis traits slightly reduced their association. However, association with adiposity and glucose homeostasis phenotypes is not significant following multiple comparisons adjustment. Trending association after multiple comparisons adjustment remains suggestive of a role for genetic variation of INSIG2 in obesity, but these results require validation.
Figures
Similar articles
-
Polymorphisms near SOCS3 are associated with obesity and glucose homeostasis traits in Hispanic Americans from the Insulin Resistance Atherosclerosis Family Study.Hum Genet. 2009 Mar;125(2):153-62. doi: 10.1007/s00439-008-0608-3. Epub 2008 Dec 13. Hum Genet. 2009. PMID: 19083014 Free PMC article.
-
Analysis of FTO gene variants with measures of obesity and glucose homeostasis in the IRAS Family Study.Hum Genet. 2009 Jun;125(5-6):615-26. doi: 10.1007/s00439-009-0656-3. Epub 2009 Mar 26. Hum Genet. 2009. PMID: 19322589 Free PMC article.
-
Genetic variants in selenoprotein P plasma 1 gene (SEPP1) are associated with fasting insulin and first phase insulin response in Hispanics.Gene. 2014 Jan 15;534(1):33-9. doi: 10.1016/j.gene.2013.10.035. Epub 2013 Oct 24. Gene. 2014. PMID: 24161883 Free PMC article.
-
Analysis of FTO gene variants with obesity and glucose homeostasis measures in the multiethnic Insulin Resistance Atherosclerosis Study cohort.Int J Obes (Lond). 2011 Sep;35(9):1173-82. doi: 10.1038/ijo.2010.244. Epub 2010 Nov 23. Int J Obes (Lond). 2011. PMID: 21102551 Free PMC article.
-
Visceral adiposity and inflammatory bowel disease.Int J Colorectal Dis. 2021 Nov;36(11):2305-2319. doi: 10.1007/s00384-021-03968-w. Epub 2021 Jun 9. Int J Colorectal Dis. 2021. PMID: 34104989 Review.
Cited by
-
Common INSIG2 polymorphisms are associated with age-related changes in body size and high-density lipoprotein cholesterol from young adulthood to middle age.Metabolism. 2010 Aug;59(8):1084-91. doi: 10.1016/j.metabol.2009.11.005. Epub 2009 Dec 31. Metabolism. 2010. PMID: 20045156 Free PMC article.
-
Gene-by-environment Interactions and Adaptive Body Size Variation in Mice From the Americas.Mol Biol Evol. 2025 Apr 1;42(4):msaf078. doi: 10.1093/molbev/msaf078. Mol Biol Evol. 2025. PMID: 40172935 Free PMC article.
-
INSIG2 variants, dietary patterns and metabolic risk in Samoa.Eur J Clin Nutr. 2013 Jan;67(1):101-7. doi: 10.1038/ejcn.2012.124. Epub 2012 Sep 12. Eur J Clin Nutr. 2013. PMID: 22968099 Free PMC article.
-
The gene-gene interaction of INSIG-SCAP-SREBP pathway on the risk of obesity in Chinese children.Biomed Res Int. 2014;2014:538564. doi: 10.1155/2014/538564. Epub 2014 Jun 17. Biomed Res Int. 2014. PMID: 25028659 Free PMC article. Clinical Trial.
-
Understanding the growing epidemic of type 2 diabetes in the Hispanic population living in the United States.Diabetes Metab Res Rev. 2019 Feb;35(2):e3097. doi: 10.1002/dmrr.3097. Epub 2018 Dec 4. Diabetes Metab Res Rev. 2019. PMID: 30445663 Free PMC article. Review.
References
-
- Goldstein JL, DeBose-Boyd RA, Brown MS. Protein sensors for membrane sterols. Cell. 2006;124:35–46. - PubMed
-
- Herbert A, Gerry NP, McQueen MB, Heid IM, Pfeufer A, Illig T, et al. A Common Genetic Variant Is Associated with Adult and Childhood Obesity. Science. 2006;312:279–283. - PubMed
-
- Dina C, Meyre D, Samson C, Tichet J, Marre M, Jouret B, et al. Comment on “A Common Genetic Variant is Associated with Adult and Childhood Obesity. Science. 2007;315:187b. - PubMed
-
- Feng Y, Dong H, Xiang Q, Hong X, Wilker E, Zhang Y, et al. Lack of association between rs7566605 and obesity in a Chinese population. Human Genetics. 2006;20:743–745. - PubMed
Publication types
MeSH terms
Substances
Grants and funding
LinkOut - more resources
Full Text Sources
Medical
Research Materials
