

Inferring the demographic history of African farmers and pygmy hunter-gatherers using a multilocus resequencing data set
- PMID: 19360089
- PMCID: PMC2661362
- DOI: 10.1371/journal.pgen.1000448
Inferring the demographic history of African farmers and pygmy hunter-gatherers using a multilocus resequencing data set
Abstract
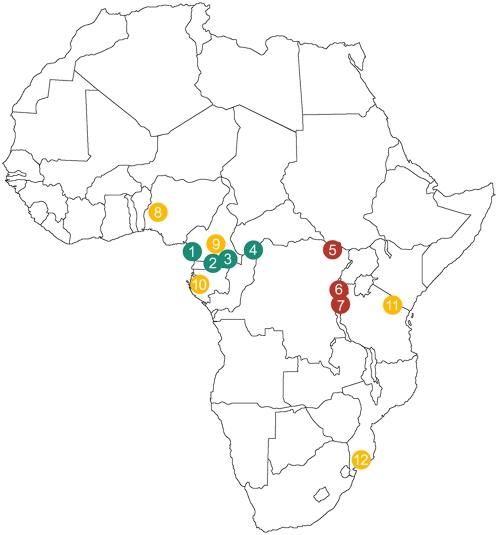
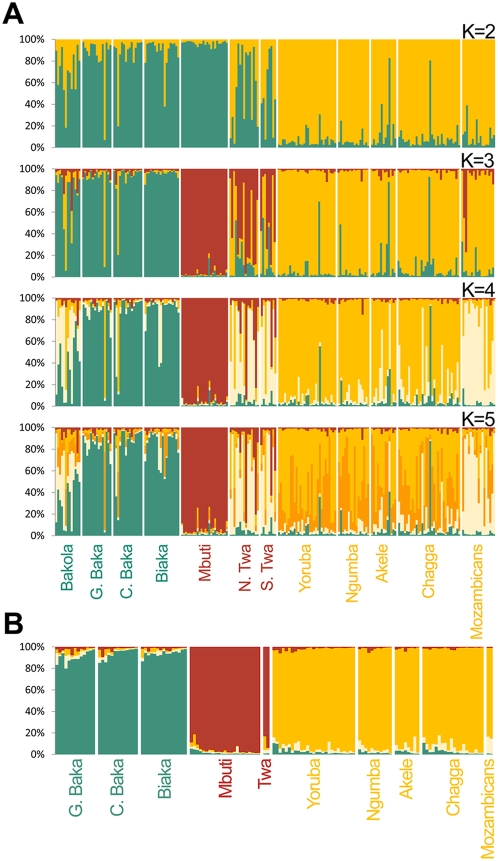
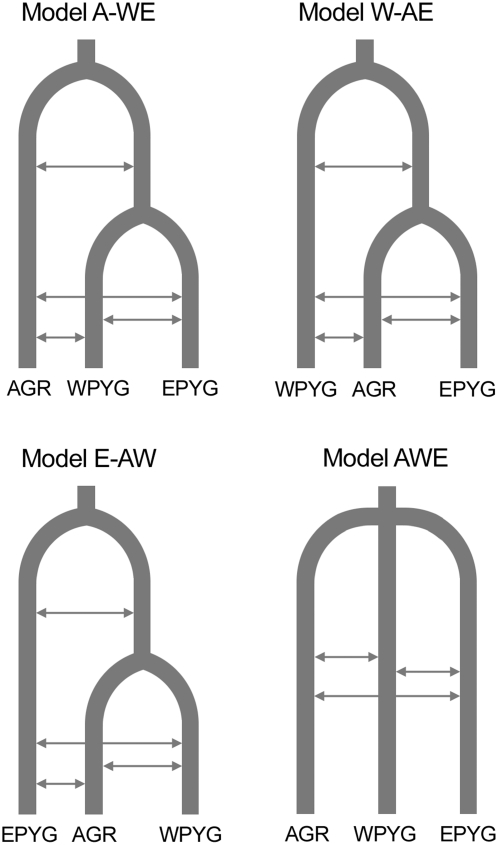
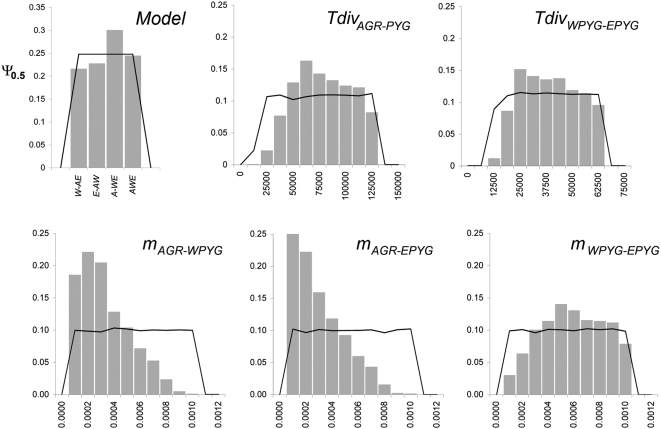
The transition from hunting and gathering to farming involved a major cultural innovation that has spread rapidly over most of the globe in the last ten millennia. In sub-Saharan Africa, hunter-gatherers have begun to shift toward an agriculture-based lifestyle over the last 5,000 years. Only a few populations still base their mode of subsistence on hunting and gathering. The Pygmies are considered to be the largest group of mobile hunter-gatherers of Africa. They dwell in equatorial rainforests and are characterized by their short mean stature. However, little is known about the chronology of the demographic events-size changes, population splits, and gene flow--ultimately giving rise to contemporary Pygmy (Western and Eastern) groups and neighboring agricultural populations. We studied the branching history of Pygmy hunter-gatherers and agricultural populations from Africa and estimated separation times and gene flow between these populations. We resequenced 24 independent noncoding regions across the genome, corresponding to a total of approximately 33 kb per individual, in 236 samples from seven Pygmy and five agricultural populations dispersed over the African continent. We used simulation-based inference to identify the historical model best fitting our data. The model identified included the early divergence of the ancestors of Pygmy hunter-gatherers and farming populations approximately 60,000 years ago, followed by a split of the Pygmies' ancestors into the Western and Eastern Pygmy groups approximately 20,000 years ago. Our findings increase knowledge of the history of the peopling of the African continent in a region lacking archaeological data. An appreciation of the demographic and adaptive history of African populations with different modes of subsistence should improve our understanding of the influence of human lifestyles on genome diversity.
Conflict of interest statement
The authors have declared that no competing interests exist.
Figures
Similar articles
-
Maternal traces of deep common ancestry and asymmetric gene flow between Pygmy hunter-gatherers and Bantu-speaking farmers.Proc Natl Acad Sci U S A. 2008 Feb 5;105(5):1596-601. doi: 10.1073/pnas.0711467105. Epub 2008 Jan 23. Proc Natl Acad Sci U S A. 2008. PMID: 18216239 Free PMC article.
-
An early divergence of KhoeSan ancestors from those of other modern humans is supported by an ABC-based analysis of autosomal resequencing data.Mol Biol Evol. 2012 Feb;29(2):617-30. doi: 10.1093/molbev/msr212. Epub 2011 Sep 1. Mol Biol Evol. 2012. PMID: 21890477 Free PMC article.
-
Insights into the demographic history of African Pygmies from complete mitochondrial genomes.Mol Biol Evol. 2011 Feb;28(2):1099-110. doi: 10.1093/molbev/msq294. Epub 2010 Nov 1. Mol Biol Evol. 2011. PMID: 21041797
-
The demographic and adaptive history of central African hunter-gatherers and farmers.Curr Opin Genet Dev. 2018 Dec;53:90-97. doi: 10.1016/j.gde.2018.07.008. Epub 2018 Aug 10. Curr Opin Genet Dev. 2018. PMID: 30103089 Review.
-
African population history: an ancient DNA perspective.Curr Opin Genet Dev. 2020 Jun;62:8-15. doi: 10.1016/j.gde.2020.05.008. Epub 2020 Jun 18. Curr Opin Genet Dev. 2020. PMID: 32563853 Review.
Cited by
-
Patterns of ancestry, signatures of natural selection, and genetic association with stature in Western African pygmies.PLoS Genet. 2012;8(4):e1002641. doi: 10.1371/journal.pgen.1002641. Epub 2012 Apr 26. PLoS Genet. 2012. PMID: 22570615 Free PMC article.
-
African Pygmies, what's behind a name?Hum Biol. 2012 Feb;84(1):1-10. doi: 10.3378/027.084.0105. Hum Biol. 2012. PMID: 22452426 Free PMC article. No abstract available.
-
Inference of Coalescence Times and Variant Ages Using Convolutional Neural Networks.Mol Biol Evol. 2023 Oct 4;40(10):msad211. doi: 10.1093/molbev/msad211. Mol Biol Evol. 2023. PMID: 37738175 Free PMC article.
-
Inferring admixture histories of human populations using linkage disequilibrium.Genetics. 2013 Apr;193(4):1233-54. doi: 10.1534/genetics.112.147330. Epub 2013 Feb 14. Genetics. 2013. PMID: 23410830 Free PMC article.
-
Genome-wide insights into the genetic history of human populations.Investig Genet. 2015 Apr 1;6:6. doi: 10.1186/s13323-015-0024-0. eCollection 2015. Investig Genet. 2015. PMID: 25834724 Free PMC article.
References
-
- Quintana-Murci L, Semino O, Bandelt HJ, Passarino G, McElreavey K, et al. Genetic evidence of an early exit of Homo sapiens sapiens from Africa through eastern Africa. Nat Genet. 1999;23:437–441. - PubMed
-
- Ingman M, Kaessmann H, Pääbo S, Gyllensten U. Mitochondrial genome variation and the origin of modern humans. Nature. 2000;408:708–713. - PubMed
Publication types
MeSH terms
Grants and funding
LinkOut - more resources
Full Text Sources
