. 2009 Apr;5(4):e1000353.
doi: 10.1371/journal.pcbi.1000353. Epub 2009 Apr 10.

A dynamic network approach for the study of human phenotypes

Affiliations

A dynamic network approach for the study of human phenotypes

César A Hidalgo et al. PLoS Comput Biol. 2009 Apr.

Abstract

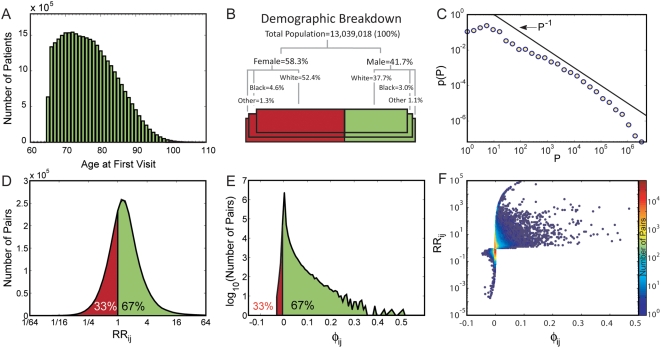
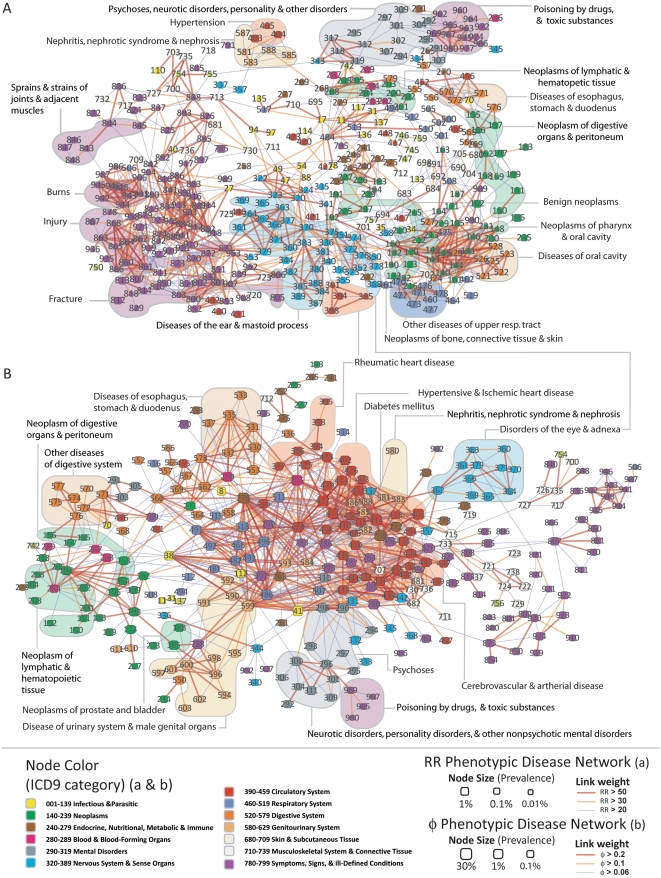
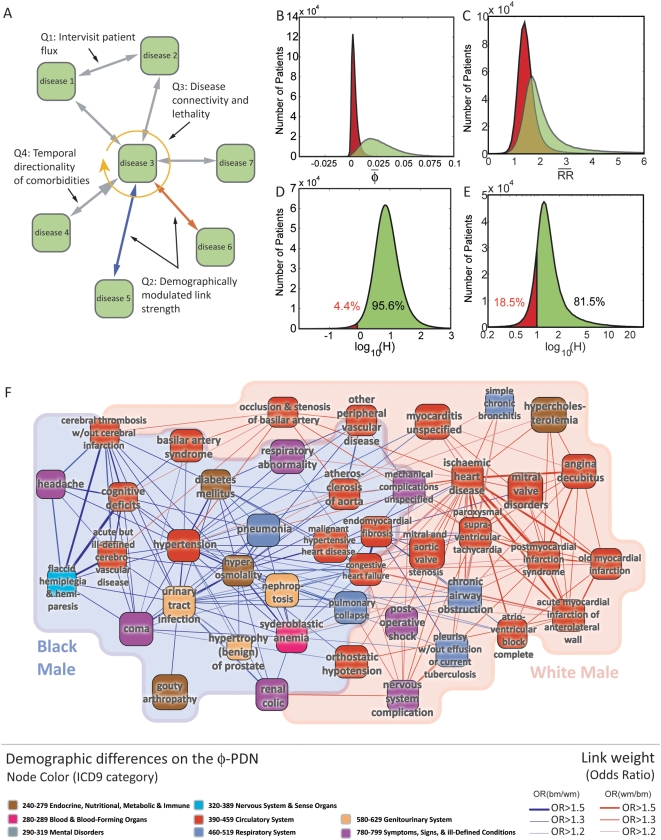
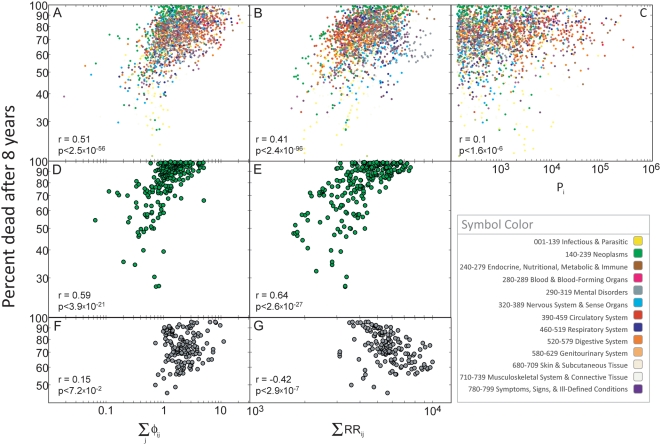
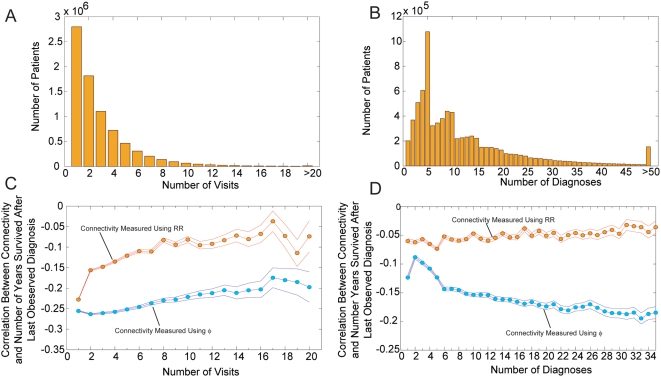
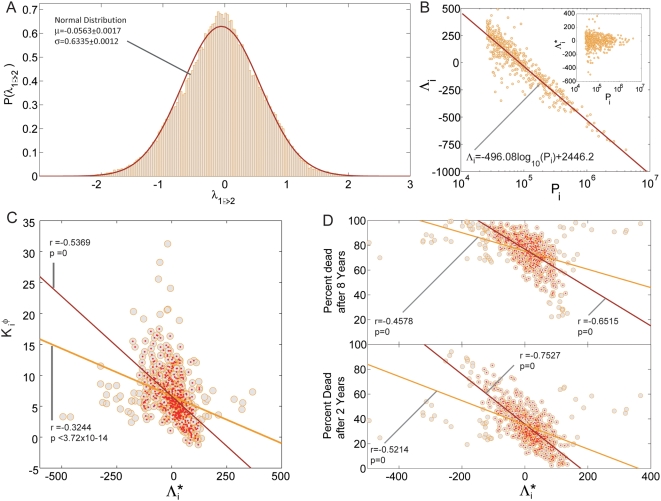
The use of networks to integrate different genetic, proteomic, and metabolic datasets has been proposed as a viable path toward elucidating the origins of specific diseases. Here we introduce a new phenotypic database summarizing correlations obtained from the disease history of more than 30 million patients in a Phenotypic Disease Network (PDN). We present evidence that the structure of the PDN is relevant to the understanding of illness progression by showing that (1) patients develop diseases close in the network to those they already have; (2) the progression of disease along the links of the network is different for patients of different genders and ethnicities; (3) patients diagnosed with diseases which are more highly connected in the PDN tend to die sooner than those affected by less connected diseases; and (4) diseases that tend to be preceded by others in the PDN tend to be more connected than diseases that precede other illnesses, and are associated with higher degrees of mortality. Our findings show that disease progression can be represented and studied using network methods, offering the potential to enhance our understanding of the origin and evolution of human diseases. The dataset introduced here, released concurrently with this publication, represents the largest relational phenotypic resource publicly available to the research community.


Conflict of interest statement

The authors have declared that no competing interests exist.

Figures

Figure 1
Figure 1. Data characteristics and basic comorbidity statistics.
A. Age distribution for the study population. B. Demographic breakdown of the study population. C. Prevalence distribution for all diseases measured using ICD9 codes at the 5 digit level. D. Distribution of the relative risk (RR) between all disease pairs. E. Distribution of the φ-correlation between all disease pairs. F. Scatter plot between the φ-correlation and the relative risk of disease pairs.
Figure 2
Figure 2. Phenotypic Disease Networks (PDNs).
Nodes are diseases; links are correlations. Node color identifies the ICD9 category; node size is proportional to disease prevalence. Link color indicates correlation strength. A. PDN constructed using RR. Only statistically significant links with RRij>20 are shown. B. PDN built using φ-correlation. Here all statistically significant links where φ>0.06 are shown.
Figure 3
Figure 3. The Phenotypic Disease Network and disease dynamics.
A. Schematic representation of the three dynamical questions explore here. B. Average φ-correlation between diseases diagnosed in the first two and last two visits for the 946,580 patients with 4 visits (green) and when we consider a randomized set of diseases for the first two visits (red). C. Same as B but for the RR-PDN. D. Ratio between the average φ-correlation among diagnoses received by a patient in its first two and last two visits relative to the control case. E. same as D but for the RR-PDN. F. Gender and race differences. The subset of Fig 2 B where all diseases connected to hypertension and ischemic heart disease is shown. Blue links indicate comorbidities that are strongest among black males; whereas red links indicate comorbidities that are strongest among white males (see legend).
Figure 4
Figure 4. Disease connectivity and lethality.
A. Scatter plot between the connectivity of a disease measured in the φ-PDN and the percent of patients that died 8 years after this disease was first observed in our data set. B. Same as A for the RR-PDN. C. percent of patients that died 8 years after this disease was first observed in our data set as a function of disease prevalence. D. same as A showing only neoplasms. E. same as B showing only neoplasms. F. same as A showing only mental disorders. G. same as B showing only mental disorders.
Figure 5
Figure 5. Connectivity lethality control.
A. Histogram with the number of visits for each patient for which the year of death is known. B. Histogram for the number of diagnosis assigned to each patient for which the year of death is known. C. Correlation between the average connectivity of the diagnosis assigned to a patient and the number of years survived after the last diagnosis was recorded for groups of patients with the same number of hospital visits. D. Correlation between the average connectivity of the diagnosis assigned to a patient and the number of years survived after the last diagnosis was recorded for groups of patients with the same number of total number of diagnosis assigned. Error margins in C and D represent 95% confidence intervals.
Figure 6
Figure 6. Directionality of disease progression.
A. Distribution of λ1→2 B. Disease precedence Λi as a function of disease prevalence Pi. The inset shows the same plot after removing the trend from disease precedence (Λi* = ΛI+496.08log10(Pi)-2446.2) C. Disease connectivity calculated from the φ-PDN as a function of Λi*. The green line shows the best fit for the 518 diseases with a prevalence larger than 1/500 (green circles) while the red line shows the best fit for the 463 diseases at the center of the cloud (red points). The correlation coefficient is represented by r and its associated p-value by p. D. Percentage of patients that died 2 and 8 years after being diagnosed with a disease with a given detrended precedence Λi*. The green lines show the best fit for all the 518 diseases (green circles) while the red lines show the fit for the 434 (top panel) and 465 (bottom panel) diseases at the bulk of the cloud.

Similar articles

Cited by

References

    1. Goh K-I, Cusick ME, Valle D, Childs B, Vidal M, et al. The human disease network. Proc Natl Acad Sci U S A. 2007;104:8685–8690. - PMC - PubMed
    1. Feldman I, Rzhetsky A, Vitkup D. Network properties of genes harboring inherited disease mutations. Proc Natl Acad Sci U S A. 2008;105:4323–4328. - PMC - PubMed
    1. Rual JF, Venkatesan K, Hao T, Hirozane-Kishikawa T, Dricot A, et al. Towards a proteome-scale map of the human protein-protein interaction network. Nature. 2005;7062:1173–1178. - PubMed
    1. Stelzl U, Worm U, Lalowski M, Haenig C, Brembeck FH, et al. A Human Protein-Protein Interaction Network: A Resource for Annotating the Proteome. Cell. 2005;122:957–968. - PubMed
    1. Lim J, Hao T, Shaw C, Patel AJ, Szabó G, et al. A Protein–Protein Interaction Network for Human Inherited Ataxias and Disorders of Purkinje Cell Degeneration. Cell. 2006;125:801–814. - PubMed

Publication types