. 2009 Apr;5(4):e1000372.
doi: 10.1371/journal.ppat.1000372. Epub 2009 Apr 10.

Association of progressive CD4(+) T cell decline in SIV infection with the induction of autoreactive antibodies

Affiliations

Association of progressive CD4(+) T cell decline in SIV infection with the induction of autoreactive antibodies

Takeo Kuwata et al. PLoS Pathog. 2009 Apr.

Abstract

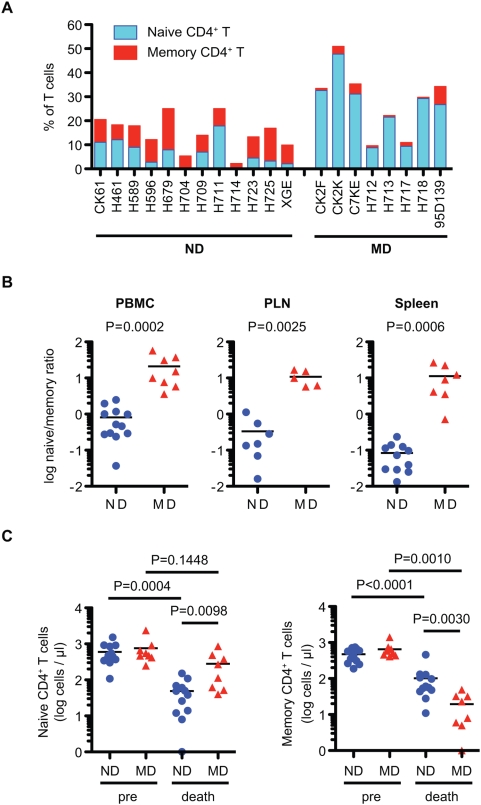
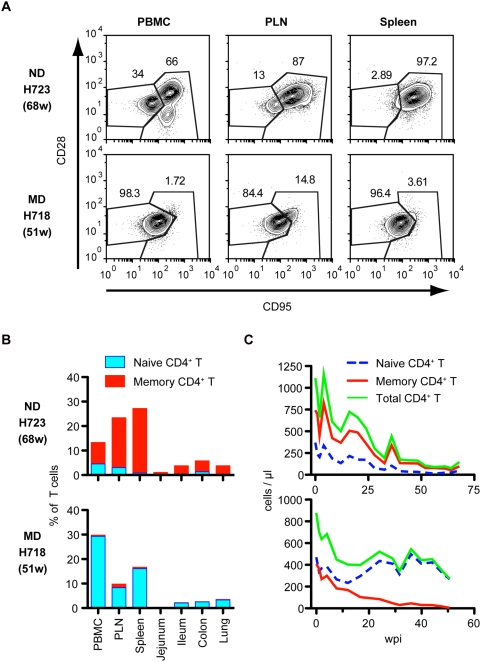
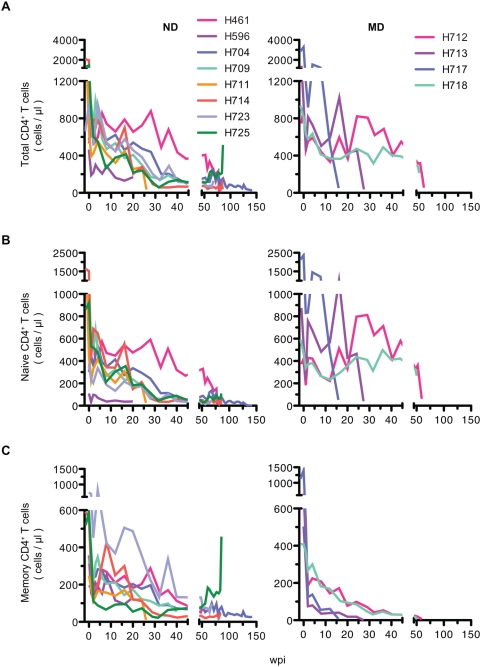
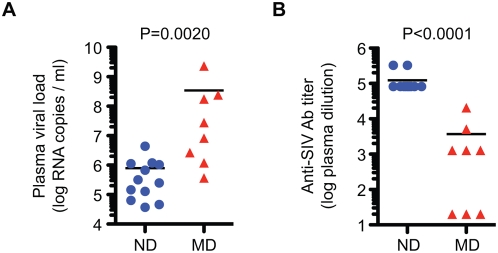
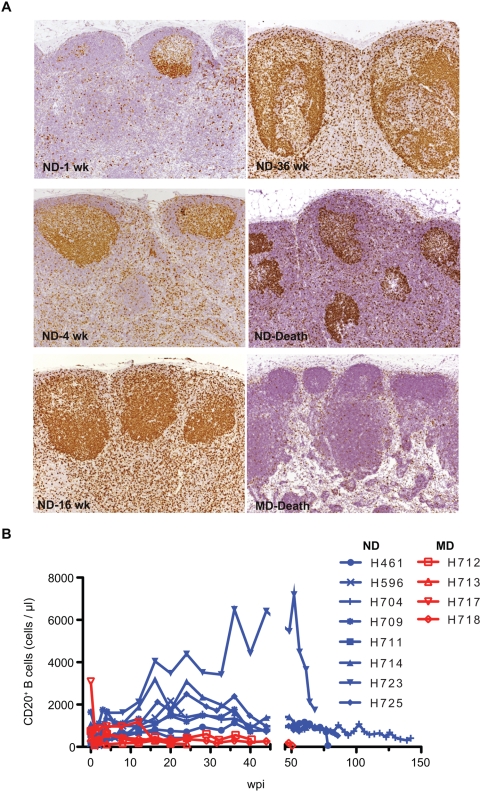
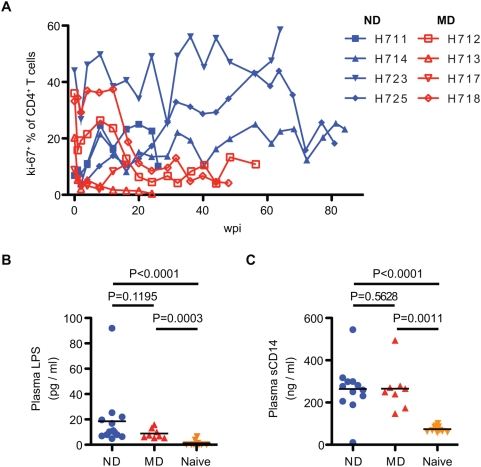
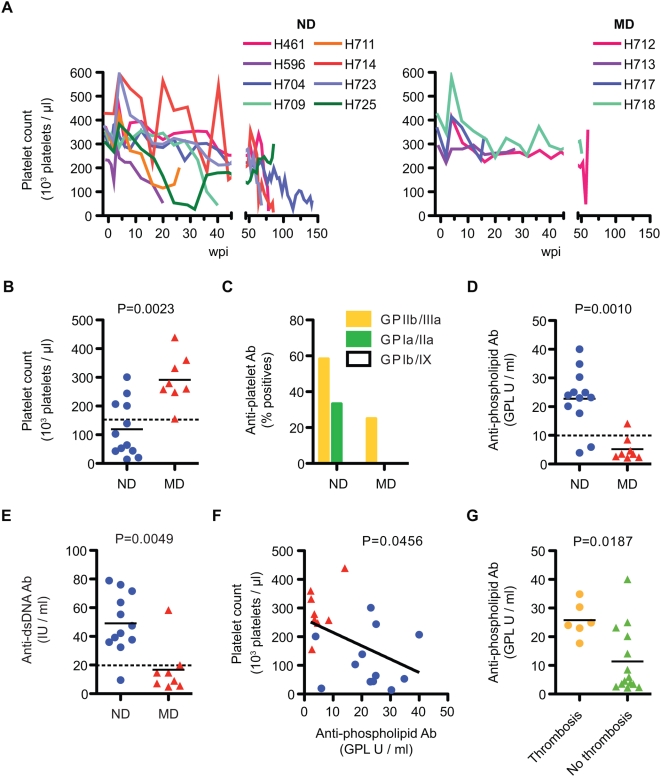
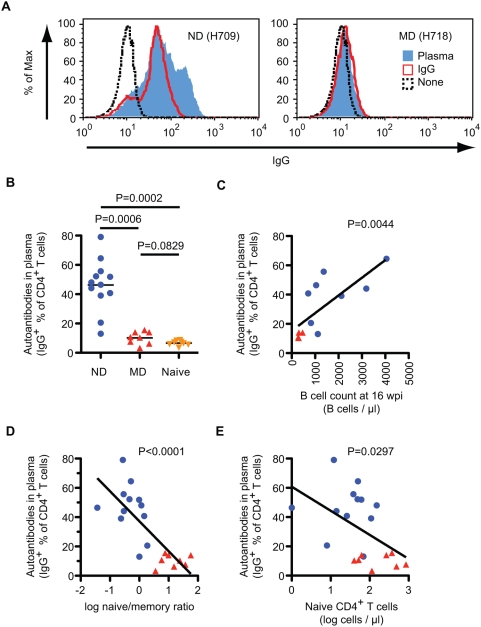
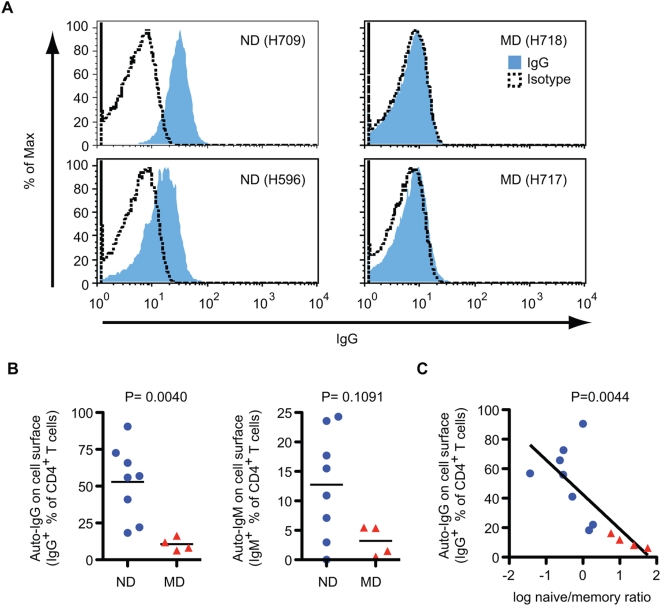
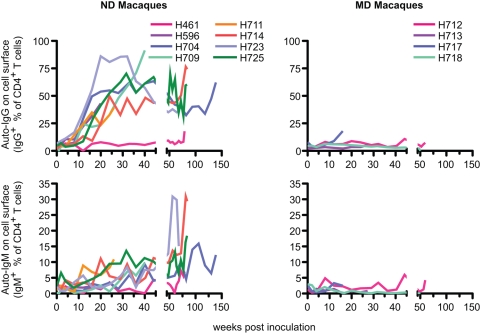
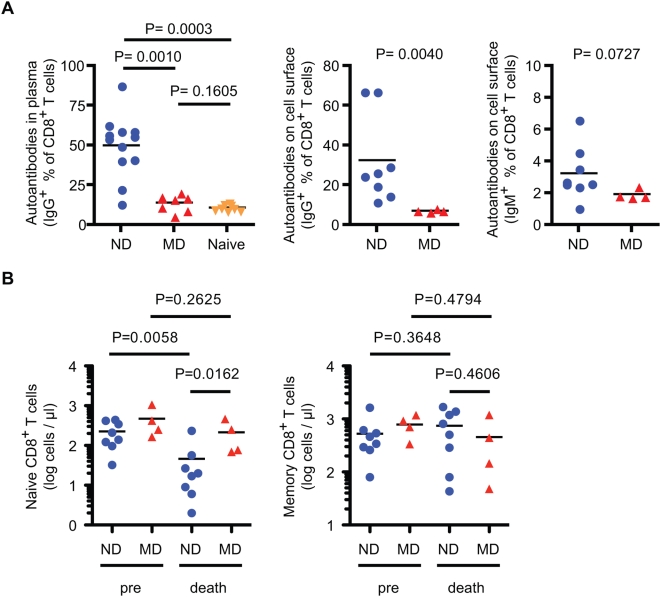
The progressive decline of CD4(+) T cells is a hallmark of disease progression in human immunodeficiency virus (HIV) and simian immunodeficiency virus (SIV) infection. Whereas the acute phase of the infection is dominated by virus-mediated depletion of memory CD4(+) T cells, chronic infection is often associated with a progressive decline of total CD4(+) T cells, including the naïve subset. The mechanism of this second phase of CD4(+) T cell loss is unclear and may include immune activation-induced cell death, immune-mediated destruction, and regenerative or homeostatic failure. We studied patterns of CD4(+) T cell subset depletion in blood and tissues in a group of 20 rhesus macaques inoculated with derivatives of the pathogenic SIVsmE543-3 or SIVmac239. Phenotypic analysis of CD4(+) T cells demonstrated two patterns of CD4(+) T cell depletion, primarily affecting either naïve or memory CD4(+) T cells. Progressive decline of total CD4(+) T cells was observed only in macaques with naïve CD4(+) T cell depletion (ND), though the depletion of memory CD4(+) T cells was profound in macaques with memory CD4(+) T cell depletion (MD). ND macaques exhibited lower viral load and higher SIV-specific antibody responses and greater B cell activation than MD macaques. Depletion of naïve CD4(+) T cells was associated with plasma antibodies autoreactive with CD4(+) T cells, increasing numbers of IgG-coated CD4(+) T cells, and increased incidence of autoreactive antibodies to platelets (GPIIIa), dsDNA, and phospholipid (aPL). Consistent with a biological role of these antibodies, these latter antibodies were accompanied by clinical features associated with autoimmune disorders, thrombocytopenia, and catastrophic thrombotic events. More importantly for AIDS pathogenesis, the level of autoreactive antibodies significantly correlated with the extent of naïve CD4(+) T cell depletion. These results suggest an important role of autoreactive antibodies in the CD4(+) T cell decline observed during progression to AIDS.


Conflict of interest statement

The authors have declared that no competing interests exist.

Figures

Figure 1
Figure 1. Two patterns of CD4+ T cell decline in SIV infection.
(A) Classification of the 20 study macaques as memory depletion (MD) or naïve depletion (ND). Naive (blue) and memory (red) CD4+ T cells in total T cells in PBMC from 20 macaques at death are shown. Naive (CD95lowCD28high) and memory (CD95highCD28high and CD95highCD28low) subsets of CD4+ T cells were analyzed by flow cytometry. (B) Comparison of naive/memory ratio in CD4+ T cells in PBMC, PLN, and spleen at death. The ratio was compared between ND (n = 12) and MD (n = 8) in PBMC, ND (n = 7) and MD (n = 5) in PLN, and ND (n = 11) and MD (n = 7) in spleen. (C) Naïve (left) and memory (right) CD4+ T cell counts in blood pre-inoculation (pre) and at death. The absolute cell numbers of ND (n = 12) and MD (n = 8) macaques at death were compared by nonparametric Mann-Whitney U test. The cell numbers pre- and at death were compared by Wilcoxon matched pairs t-test.
Figure 2
Figure 2. Representative flow cytometry and kinetics of CD4+ T cell loss in ND and MD macaques.
(A) CD4+ T cell subsets of PBMC, PLN, and spleen of macaques H723 and H718 are shown as representatives of ND and MD macaques, respectively. Naive (CD95lowCD28high) and memory (CD95highCD28high and CD95highCD28low) subsets of CD4+ T cells were analyzed by flow cytometry. (B) CD4+ T cell percentages and their subsets in various tissues from macaques, H723 (upper) and H718 (lower). Naive (blue) and memory (red) CD4+ T cells in total T cells are shown. (C) Kinetics of CD4+ T cell depletion in H723 (upper) and H718 (lower). Naive (blue dotted line), memory (red), and total (green) CD4+ T cell counts in blood are shown.
Figure 3
Figure 3. Comparison of the kinetics of CD4+ T cell subsets between ND and MD macaques.
The kinetics of total (A), naïve (B), and memory (C) CD4+ T cell decline in ND (n = 8; left panels) and MD macaques (n = 4; right panels). ND macaques show a progressive and relatively slow decline in all CD4+ T cell subsets in the blood during the course of infection, although proportionally more naïve CD4+ T cells are lost. In contrast, loss of memory CD4+ T cell is a prominent feature observed in MD macaques. A precipitous decline in white blood cell counts terminally in MD macaques results in variable degrees of terminal depletion of total and naïve CD4+ T cells.
Figure 4
Figure 4. Significant differences in plasma viral load and SIV-specific antibody responses in ND and MD macaques.
(A) Plasma viral loads at death were compared between ND (n = 12) and MD (n = 8) macaques. (B) Anti-SIV antibody titers at death were compared between ND (n = 12) and MD (n = 8) macaques by ELISA. Comparisons were performed using the nonparametric Mann-Whitney U test.
Figure 5
Figure 5. Increased lymphocyte proliferation in lymph nodes and B cell lymphocytosis in ND macaques.
(A) Proliferation of lymphocytes analyzed by immunohistochemistry for Ki-67 expression in lymph node biopsies collected at 1, 4, 16, 36 weeks post-inoculation and death of a representative ND macaque (H709) and death of a representative MD macaque (H717). Ki-67 staining of proliferating B cells in germinal centers became increasingly more intense accompanied by an increase in the number Ki-67+ cells in the paracortex (T cell area). Germinal centers became larger with time in the ND macaque. This contrasted with the minimal proliferation observed in the lymph nodes of the representative MD macaque. (B) Analysis of CD20+ B cells in the blood in ND macaques (n = 8) and MD macaques (n = 4) showed B cell lymphocytosis in many of the ND macaques.
Figure 6
Figure 6. Proliferation of CD4+ T cells and microbial translocation in SIV-infected macaques.
(A) Proliferation of CD4+ T cells was analyzed by Ki-67 coexpression. Kinetics of percentage of Ki-67+CD4+ T cells in ND (blue) and MD (red) macaques are shown with increasing percentages in ND macaques over the course of infection. (B) Plasma LPS levels were determined in ND (n = 12), MD (n = 8), and SIV-naïve (n = 10) macaques. LPS levels in ND and MD macaques at death were significantly higher than naïve macaques. (C) Plasma levels of sCD14 in ND and MD macaques. LPS and sCD14 levels were compared by nonparametric Mann-Whitney U test.
Figure 7
Figure 7. Autoimmune manifestation and autoantibodies in SIV-Infected macaques.
(A) Progressive decline of platelets in the blood in ND macaques (n = 8, left), contrasted with more stable levels in MD macaques (n = 4, right). (B) Platelet counts in blood at death were significantly different between ND (n = 12) and MD (n = 8) macaques. (C) A trend to higher frequency of anti-platelet antibodies was observed in plasma samples at death in ND (n = 12) as compared to MD (n = 8) macaques. (D) Anti-phospholipid (aPL) Ab titers at death were significantly higher in ND (n = 12) than in MD (n = 8) macaques. (E) Higher levels of anti-dsDNA Ab titer at death in ND (n = 12) versus MD (n = 8) macaques. (F) A significant correlation was observed between aPL titer and platelet count. Platelet count and aPL titer at death were plotted using ND (blue circles, n = 12) and MD (red triangles, n = 8) macaques. A linear regression analysis indicated a regression line with a slope = −4.66±2.17 (R2 = 0.204). (G) Anti-phospholipid antibody titers at death were compared between macaques with thrombosis (n = 6) and without thrombosis (n = 14). Macaques with thrombosis showed a significantly higher level of aPL antibodies.
Figure 8
Figure 8. Viruses from ND macaques use CCR5 as co-receptor.
Co-receptor usage of viruses in ND macaques and parental SIV strains was analyzed using CCR5 and CXCR4 antagonists, TAK779 and AMD3100, respectively. TZM-bl cells were incubated with pseudotyped viruses in the absence or presence of the designated concentration of antagonist. The mean percentage of the control luciferase activity is shown with standard errors. Pseudotyped viruses were prepared using Env of SIVsmH635FC and SIVsmE543-2, and two Env clones each from H704 and H709. The infection with pseudotyped viruses with Env from H704 and H709 were inhibited by TAK779, but not AMD3100, similar to parental SIVsmH635FC and SIVsmE543-3. In contrast, the X4-tropic HIV-1NL43-3 was inhibited by AMD3100, but not TAK779.
Figure 9
Figure 9. Plasma antibodies autoreactive to CD4+ T cells in ND macaques.
(A) Antibodies against CD4+ T cells were analyzed using plasma and purified IgG from infected macaques. PBMC from SIV-uninfected macaques were incubated with plasma (5-fold–diluted, blue line) or purified IgG (1.5 mg/ml, red line) from ND (H709, left) or MD (H718, right) macaques, and stained with antibodies against monkey IgG (FITC), CD3 (PerCP-Cy5.5), and CD4 (APC). A histogram of monkey IgG is shown after gating CD3+CD4+ cells. Dashed line; IgG reactivity of untreated PBMC. (B) Autoantibodies in terminal plasma samples were compared among ND (n = 12), MD (n = 8), and SIV-naïve (n = 8) macaques. Percentages of IgG+ cells in CD4+ T cells were determined by the Overton cumulative histogram subtraction using untreated PBMC as a control. (C) Correlation between autoantibodies to CD4+ T cells in plasma and B cell count in blood at 16 wpi. Percentages of IgG+ cells in CD4+ T cells and B cell counts were plotted using ND (blue circles, n = 8) and MD (red triangles, n = 4) macaques. A linear regression analysis indicated a regression line with a slope = 0.012±0.003 (R2 = 0.572). (D) Correlation between autoantibodies to CD4+ T cells in plasma and log naïve/memory ratio in CD4+ T cells at death. Percentages of IgG+ cells in CD4+ T cells and log naïve/memory ratio in CD4+ T cells were plotted using ND (blue circles, n = 12) and MD (red triangles, n = 8) macaques. A linear regression analysis indicated a regression line with a slope = −20.5±4.04 (R2 = 0.588). (E) Correlation between autoantibodies to CD4+ T cells in plasma and log naïve CD4+ T cell number at death. Percentages of IgG+ cells in CD4+ T cells and log absolute naïve CD4+ T cell number were plotted using ND (blue circles, n = 12) and MD (red triangles, n = 8) macaques. A linear regression analysis indicated a regression line with a slope = −16.5±6.97 (R2 = 0.237).
Figure 10
Figure 10. Autontibodies on the surface of CD4+ T cells in ND macaques.
(A) Autoantibodies on the surface of CD4+ T cells from ND (H709, left) and MD (H718, right) macaques in representative flow cytometric analysis. Frozen PBMC samples at death were stained with antibodies against CD4 (FITC), human IgG (PE), 7-AAD (PerCP), and CD3 (APC). Autoantibodies were examined by anti-IgG reactivity (blue) on the surface of live CD4+ T cells (7-AADCD3+CD4+). Dashed line, staining with IgG1 isotype control (PE) instead of anti-human IgG (PE). (B) The percent of autoantibody positive CD4+ T cells at death were compared between ND (n = 8) and MD (n = 4) macaques. Percentages of IgG+ (left) or IgM+ (right) CD4+ T cells were determined by the Overton cumulative histogram subtraction using a mouse IgG1 isotype control. (C) Correlation between autoantibodies on CD4+ T cells and log naïve/memory ratio in CD4+ T cells at death. Percentages of IgG+ cells in CD4+ T cells and log naïve/memory ratio in CD4+ T cells were plotted using ND (blue circles, n = 8) and MD (red triangles, n = 4) macaques.
Figure 11
Figure 11. The kinetics of induction of antibodies autoreactive to CD4+ T cells.
Kinetics of IgG (upper) and IgM (lower) on the surface of CD4+ T cells from ND (left, n = 8) and MD (right, n = 4) macaques are shown graphically. Frozen PBMC samples were stained with antibodies against CD4 (FITC), human IgG, IgM, or IgG1 isotype control (PE), 7-AAD (PerCP), and CD3 (APC). Percentages of IgG+ or IgM+ cells in live CD4+ T cells (7-AADCD3+CD4+) were determined by the Overton cumulative histogram subtraction using mouse IgG1 isotype control.
Figure 12
Figure 12. Antibodies autoreactive to CD8+ T cells and decline of naïve CD8+ T cells in ND macaques.
(A) Autoantibodies against CD8+ T cells in plasma (left) were analyzed using CD4 T cells, and were compared among ND (n = 12), MD (n = 8), and SIV-uninfected (n = 8) macaques, as described in Figure 9. Autoantibodies on the surface of CD8+ T cells (right two panels) were analyzed using CD8+ T cells, and were compared between ND (n = 8) and MD (n = 4) macaques, as described in Figure 10. (B) Naive and memory CD8+ T cell count in blood at death. The absolute numbers of cells were compared between ND (n = 8) and MD (n = 4) macaques, as described in Figure 1C.

Similar articles

Cited by

References

    1. Hazenberg MD, Otto SA, van Benthem BH, Roos MT, Coutinho RA, et al. Persistent immune activation in HIV-1 infection is associated with progression to AIDS. AIDS. 2003;17:1881–1888. - PubMed
    1. Roederer M, Dubs JG, Anderson MT, Raju PA, Herzenberg LA, et al. CD8 naive T cell counts decrease progressively in HIV-infected adults. J Clin Invest. 1995;95:2061–2066. - PMC - PubMed
    1. Ullum H, Lepri AC, Victor J, Skinhoj P, Phillips AN, et al. Increased losses of CD4+CD45RA+ cells in late stages of HIV infection is related to increased risk of death: evidence from a cohort of 347 HIV-infected individuals. Aids. 1997;11:1479–1485. - PubMed
    1. Ho Tsong Fang R, Khatissian E, Monceaux V, Cumont MC, Beq S, et al. Disease progression in macaques with low SIV replication levels: on the relevance of TREC counts. AIDS. 2005;19:663–673. - PubMed
    1. Mattapallil JJ, Letvin NL, Roederer M. T-cell dynamics during acute SIV infection. AIDS. 2004;18:13–23. - PubMed

Publication types

MeSH terms