

Review
doi: 10.1007/s00381-009-0878-7.
Epub 2009 Apr 10.
Imaging of ependymomas: MRI and CT
Affiliations
- PMID: 19360419
- PMCID: PMC2744772
- DOI: 10.1007/s00381-009-0878-7
Item in Clipboard
Review
Imaging of ependymomas: MRI and CT
Childs Nerv Syst.
2009 Oct.
Abstract
The imaging features of intracranial and spinal ependymoma are reviewed with an emphasis on conventional magnetic resonance imaging (MRI), perfusion MRI and proton magnetic resonance spectroscopy, and computed tomography. Imaging manifestations of leptomeningeal dissemination of disease are described. Finally, salient imaging features obtained in the postoperative period to evaluate completeness of surgical resection, and thereafter for long-term surveillance for disease recurrence, are reviewed.
Figures
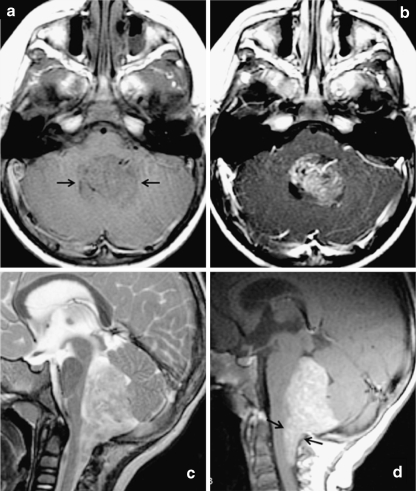
Classic MRI appearance of posterior fossa ependymoma in a 2-year-old child. Fourth ventricular mass demonstrates a low T1 signal intensity, b predominantly solid enhancement on postgadolinium T1-weighted images, and c heterogeneous T2 hyperintensity. d Sagittal postgadolinium T1-weighted image demonstrates extension inferior through the foramen of Magendie onto the posterior aspect of the upper cervical cord, a feature that is highly suggestive of ependymoma
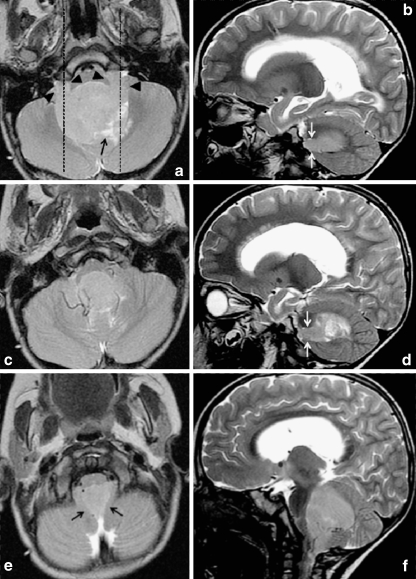
Axial and sagittal T2-weighted images through a typical fourth ventricle ependymoma demonstrate signal intensity similar to gray matter throughout most of the lesion. Extension through the foramina of Luschka is demonstrated by black arrowheads in a and white arrows in b and d, and extension through foramen of Magendie by black arrows in e. Dashed lines in a indicate planes at which sagittal images (b, d) are located. The lesion insinuates around and encases vessels, as shown in c and f. Cystic/necrotic areas (black arrows in a and d) are closer to cerebrospinal fluid signal intensity
Supratentorial ependymoma in a 10-year-old girl on a noncontrast CT, b T2-weighted, c FLAIR, and d–f postgadolinium T1-weighted MRI. Unlike posterior fossa ependymomas, most supratentorial ependymomas (70%) are extraventricular in origin. Supratentorial ependymomas usually demonstrate more heterogeneous T1 and T2 signal than their infratentorial counterparts, due to a greater tendency toward cyst formation, calcifications, and hemorrhage. Avidly enhancing areas are generally present, but are often intermixed with poorly or nonenhancing areas
Atypical, nonenhancing ependymoma in a 13-year-old. a, c, e Homogeneous FLAIR hyperintensity throughout most of the lesion, which insinuates around and encases vessels and extends through the foramina of Luschka (arrowheads in e). Temporal horn dilatation (arrows in a)) indicates hydrocephalus. As shown on postgadolinium T1-weighted images in b, d, and f, this lesion, unlike most ependymomas, demonstrates no appreciable enhancement, remaining diffusely hypointense on postgadolinium T1-weighted images
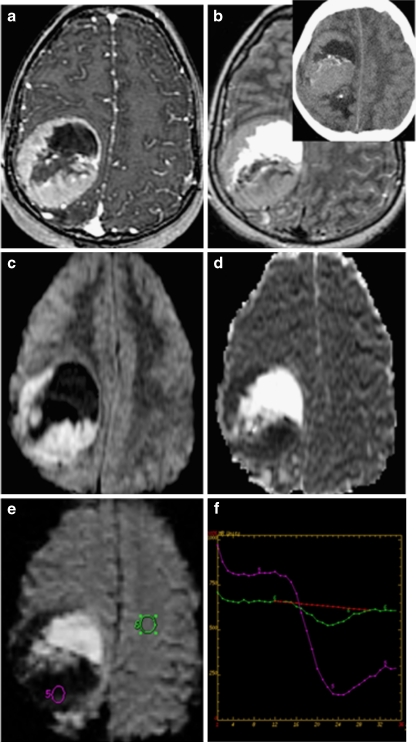
Supratentorial ependymoma on a postgadolinium T1; b FLAIR (inset: noncontrast CT); c diffusion-weighted images (DWI); d apparent diffusion coefficient; and e perfusion MRI with f cerebral blood volume measurements. DWI demonstrates reduced diffusion within the soft tissue components of some ependymomas due to high cellularity. Perfusion-weighted imaging generally demonstrates elevated blood volume within the tumor, with poor return to baseline likely attributable to lack of a blood–brain barrier. CT demonstrates isodensity or mild hyperdensity of solid soft tissue portions of the tumor, often heterogeneous enhancement on postcontrast CT (not shown) and calcifications in 50% of lesions. Although CT is more sensitive for calcification than most MRI sequences, susceptibility-sensitive diffusion- and perfusion-weighted sequences in c and e, as well as gradient-echo sequences, do commonly demonstrate areas of calcification or hemorrhage as signal void/loss
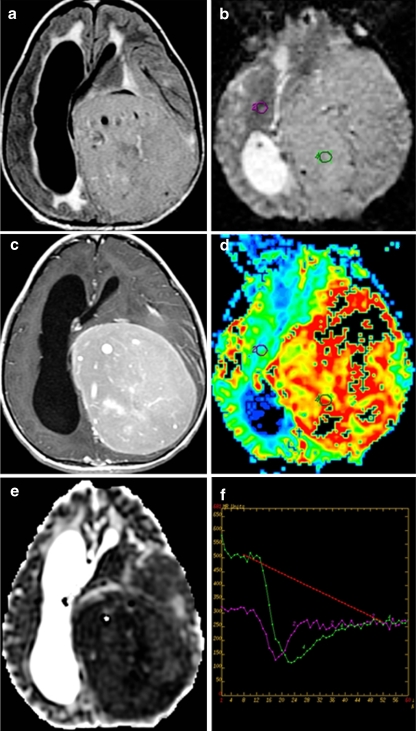
Supratentorial grade 2 ependymoma in a 12-year-old girl. a Axial FLAIR, b axial perfusion MRI, c postcontrast axial T1, d axial cerebral blood volume map derived from perfusion MRI, e axial ADC coefficient, and f perfusion MRI T2*-weighted dynamic susceptibility curves
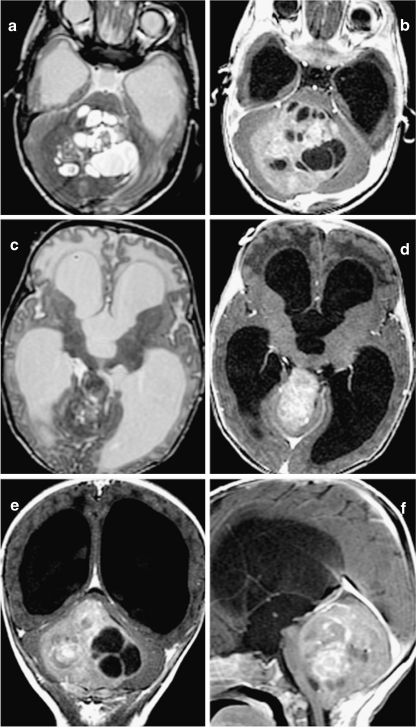
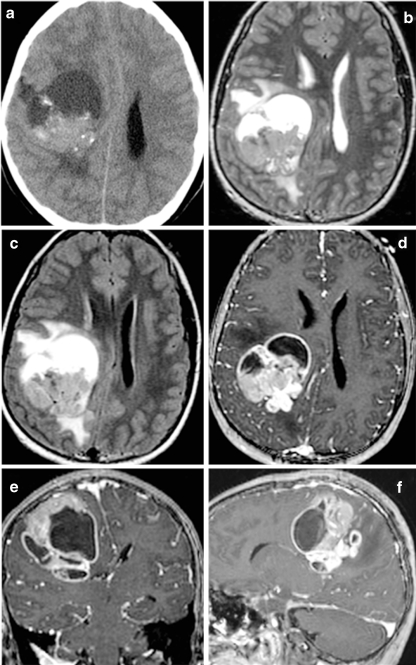
Anaplastic ependymoma in a 2-month-old infant who presented with increasing head circumference. T2-weighted sequences in a and c and postgadolinium T1-weighted sequences in b, d, e, and f. This tumor is characterized by multiple cysts, heterogeneous postcontrast enhancement, and large size resulting in severe obstructive hydrocephalus. c, d Upward extension of the tumor through the tentorial incisura
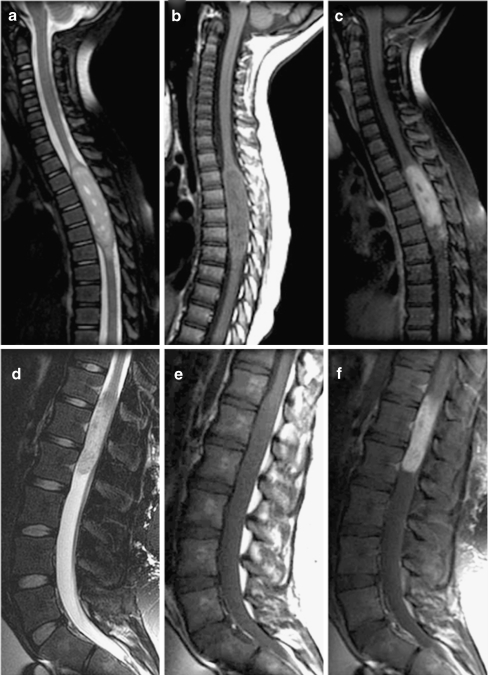
Typical spinal ependymomas. a–c T2-, T1-, and postgadolinium T1-weighted sagittal images of grade 2 ependymoma in a 3-year-old boy. d–f T2-, T1-, and postgadolinium T1-weighted images of a myxopapillary (grade 1) ependymoma in a 14-year-old boy
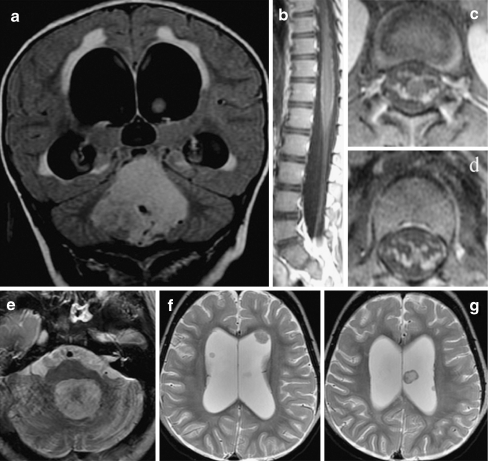
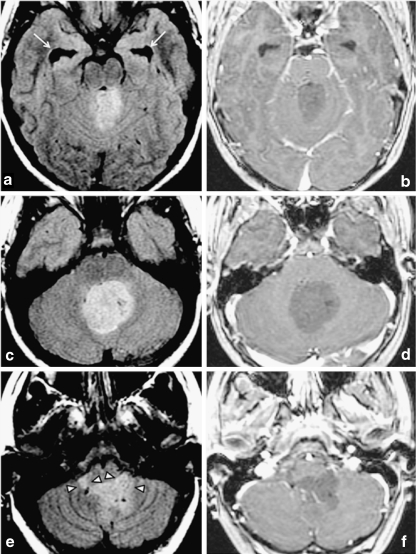
Leptomeningeal and multiple intraventricular metastases discovered 13 months after treatment of a posterior fossa ependymoma in a 2-year-old girl. Although initial MRI of the lumbar spine was suggestive of possible leptomeningeal disease, CSF cytology was negative. a) Original coronal FLAIR images at time of diagnosis. b) Sagittal and c), d) axial postgadolinium T1-weighted images of the lumbar spine at time of diagnosis. e) Thirteen months later, the resection site of the original fourth ventricular tumor demonstrates no evidence of locally recurrent disease. f) However, multiple intraventricular leptomeningeal metastases are seen and may have been attributable to CSF spread at the time of initial diagnosis
References
-
- {'text': '', 'ref_index': 1, 'ids': [{'type': 'DOI', 'value': '10.1159/000028619', 'is_inner': False, 'url': 'https://doi.org/10.1159/000028619'}, {'type': 'PubMed', 'value': '9693331', 'is_inner': True, 'url': 'https://pubmed.ncbi.nlm.nih.gov/9693331/'}]}
- Allen JC, Siffert J, Hukin J (1998) Clinical manifestations of childhood ependymoma: a multitude of syndromes. Pediatr Neurosurg 28:49–55 - PubMed
-
- {'text': '', 'ref_index': 1, 'ids': [{'type': 'PubMed', 'value': '4048443', 'is_inner': True, 'url': 'https://pubmed.ncbi.nlm.nih.gov/4048443/'}]}
- Armington WG, Osborn AG, Cubberley DA, Harnsberger HR, Boyer R, Naidich TP, Sherry RG (1985) Supratentorial ependymoma: CT appearance. Radiology 157:367–372 - PubMed
-
- None
- Barkovich AJ (2005) Pediatric neuroimaging. Lippincott, Williams and Wilkins, London
-
- {'text': '', 'ref_index': 1, 'ids': [{'type': 'DOI', 'value': '10.1007/BF00165515', 'is_inner': False, 'url': 'https://doi.org/10.1007/bf00165515'}, {'type': 'PubMed', 'value': '8817413', 'is_inner': True, 'url': 'https://pubmed.ncbi.nlm.nih.gov/8817413/'}]}
- Blaser SI, Harwood-Nash DC (1996) Neuroradiology of pediatric posterior fossa medulloblastoma. J Neurooncol 29:23–34 - PubMed
-
- {'text': '', 'ref_index': 1, 'ids': [{'type': 'DOI', 'value': '10.1542/peds.2007-1910', 'is_inner': False, 'url': 'https://doi.org/10.1542/peds.2007-1910'}, {'type': 'PubMed', 'value': '17766543', 'is_inner': True, 'url': 'https://pubmed.ncbi.nlm.nih.gov/17766543/'}]}
- Brody AS, Frush DP, Huda W, Brent RL (2007) Radiation risk to children from computed tomography. Pediatrics 120:677–682 - PubMed
