. 2009 Dec;19(12):1159-86.
doi: 10.1002/hipo.20578.

Cortical efferents of the perirhinal, postrhinal, and entorhinal cortices of the rat

Affiliations

Cortical efferents of the perirhinal, postrhinal, and entorhinal cortices of the rat

Kara L Agster et al. Hippocampus. 2009 Dec.

Abstract

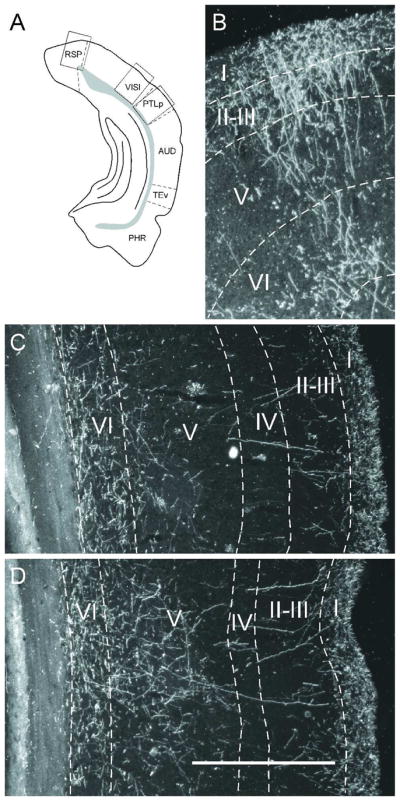
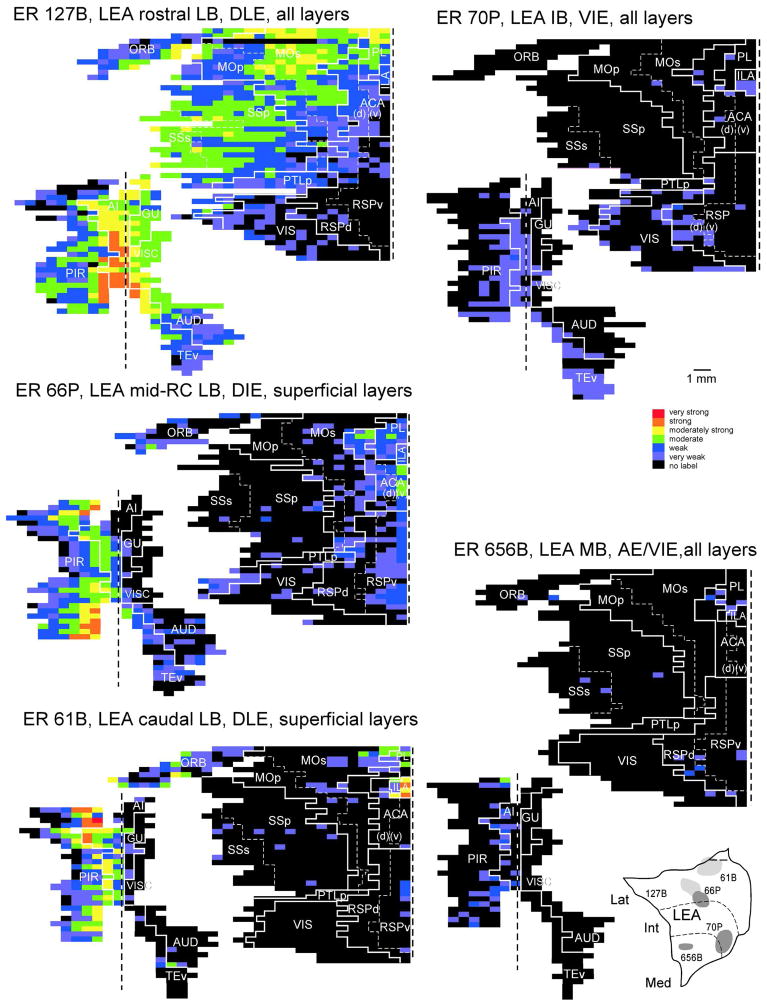
We investigated the cortical efferents of the parahippocampal region by placing injections of the anterograde tracers, Phaseolus vulgaris-leuccoagglutinin, and biotinylated dextran amine, throughout the perirhinal (PER), postrhinal (POR), and entorhinal cortices of the rat brain. The resulting density of labeled fibers was evaluated in 25 subregions of the piriform, frontal, insular, temporal, cingulate, parietal, and occipital areas. The locations of labeled terminal fibers differed substantially depending on whether the location of the injection site was in PER area 35, PER area 36, POR, or the lateral or the medial entorhinal (LEA and MEA). The differences were greater for sensory regions. For example, the POR efferents preferentially target visual and spatial regions, whereas the PER efferents target all sensory modalities. The cortical efferents of each region largely reciprocate the cortical afferents, though the degree of reciprocity varied across originating and target regions. The laminar pattern of terminal fibers was consistent with the notion that the efferents are feedback projections. The density and amount of labeled fibers also differed substantially depending on the regional location of injection sites. PER area 36 and POR give rise to a greater number of heavy projections, followed by PER area 35. LEA also gives rise to widespread cortical efferents, arising mainly from a narrow band of cortex adjacent to the PER. In contrast, the remainder of the LEA and the MEA provides only weak efferents to cortical regions. Prior work has shown that nonspatial and spatial information is transmitted to the hippocampus via the PER-LEA and POR-MEA pathways, respectively. Our findings suggest that the return projections follow the same pathways, though perhaps with less segregration.


Figures

Figure 1
Figure 1
Schematics of the perirhinal (PER), postrhinal (POR), and entorhinal (EC) cortices. A. Lateral surface view of the rat brain showing the location of PER areas 35 and 36, POR, and entorhinal areas LEA and MEA. B. Location of the anterograde tracer injection sites according to region and DG-projecting bands. Dark gray and light gray indicate tracer injections in deep and superficial layers of cortex. Medium gray indicates tracer injections that spanned superficial and deep layers of cortex. Injection sites are labeled with the names of respective cases (Table 1). C. Location of injection sites according to the entorhinal parcellation by Insausti, et al., (1997). D. Schematic of a generic unfolded map of the target regions showing subdivisions. Note that PTLp has two limbs, which we term the dorsal and caudal limbs. Abbreviations: B, biotinylated dextrane; C, caudal; D, dorsal; P, PHA-L; R, rostral; V, ventral. See list for other abbreviations. Scale bar: 1 mm.
Figure 2
Figure 2
Cortical boundaries for all cortical regions quantified for a subset of coronal sections of a representative experimental brain. Figure is adapted from Figure 4 of Burwell and Amaral (1998a), as the same regional boundaries were used for both studies. The first number represents the absolute rostrocaudal location of the plane of section (Swanson, 1992). The second number is coronal plane relative to bregma. Scale bar = 1 mm.
Figure 3
Figure 3
Unfolded maps of the density of labeled fibers resulting from injection sites in the PER. Each case is identified by case number, location and laminar position of the injection site (see icon in lower right corner). Two unfolded maps were constructed. The piriform, insular, and temporal regions were unfolded relative to the rhinal fissure (lower left of each panel). The frontal, cingulate, parietal, and visual regions were unfolded relative to the midpoint (upper right of each panel). Some regions were combined in order to simplify the maps. For each case, voxels were scored on a density scale from heaviest (6, red) to lightest (1, purple). Voxels in which there was no labeling are black in the figure. In general, labeling was heavier following area 36 than area 35 injections. For both regions there was a rostrocaudal topography in the patterns of terminal labeling. See list for abbreviations.
Figure 4
Figure 4
Labeling in the infralimbic cortex (ILA) following PER injections. A. Schematic of a coronal section showing the location of the accompanying darkfield photomicrographs (inset). B. Darkfield photomicrograph showing labeled fibers resulting from a tracer injection in rostral PER area 35 (Case 24P). This particular section shows an area of relatively heavy labeling for this particular case. Fibers were observed to terminate in all layers of the ventral IL, but were heaviest in layer III and especially V. Little to no fiber labeling was observed in PL. C. Labeled fibers resulting from a tracer injection in mid-rostrocaudal area 36 (Case 128B). Labeling was observed in all layers, but was heaviest in layers II-III and of the IL. Scant labeling was observed in PL. Other abbreviations: af, anterior forceps of the corpus callosum. Scale bar: 500 microns.
Figure 5
Figure 5
Labeling in lateral orbital frontal cortex following an injection in mid-rostrocaudal PER area 36. A. Schematic showing the coronal level of the photomicrograph. B. Darkfield photomicrograph showing the pattern of labeled fibers (Case 54P). Labeled fibers were observed in all layers. Scale bar: 500 microns.
Figure 6
Figure 6
Labeling in auditory cortex following an injection in mid-rostrocaudal PER area 36. A. Schematic showing the level of the photomicrograph. B. Darkfield photomicrograph showing the distribution of labeled fibers in auditory cortex (Case 128B). Fibers terminate preferentially in deep and superficial layers. AUDv is below the arrow. Scale bar: 500 microns.
Figure 7
Figure 7
Unfolded maps of the density of labeled fibers resulting from injection sites in the POR. Each case is identified by case number, location and laminar position of the injection site (see icon in lower right corner). Voxels in which there was no labeling are black in the figure. Injections in all rostrocaudal levels of POR produced labeled fibers in caudal TEv and visual cortex. The more caudal the injection site, the heavier the labeling in visual regions. See list for abbreviations.
Figure 8
Figure 8
Labeling in TEv following PER and POR injections. A. Schematic showing the location of the darkfield photomicrographs. B. Labeled fibers following a tracer injection to mid-rostrocaudal PER area 36 (Case 128B) were heaviest in layerVI, moderate density of labeled fibers is observed in superficial layers, and in V to a lesser extent. C. Labeled fibers resulting from anterograde tracer injection to caudal POR (Case 39P). Fibers terminate preferentially in deep layer VI. Scale bar: 500 microns.
Figure 9
Figure 9
Labeling in posterior cortical regions following a POR injection (Case 39P). A. Schematic showing the level and location of the darkfield photomicrographs in panels B-D. B. Fibers were observed in all layers of retrosplenial cortex, but were heaviest in layers I-II. C. Labeling in lateral visual cortex was observed in all layers, but was heavy in layers I and VI. D. Labeled fibers in the posterior parietal cortex were observed in all layers, but were most dense in layers I, deep V, and VI. Scale bar: 500 microns.
Figure 10
Figure 10
Unfolded maps of the density of labeled fibers resulting from injection sites in the lateral entorhinal area (LEA). Maps are labeled with the case name, location, band, and layers involved in the injection site (see icon in lower right corner). Voxels in which there was no labeling are black in the figure. The heaviest labeling resulted from injections in the lateral band (LB), especially the rostral LB. However, it should be noted that the rostral site involved all layers and the med-RC and caudal sites involved only superficial layers. Because the the cortical efferents arise in deep layers, it might be expected that labeling would be weaker. Rostral injection sites targeted frontal, insular, piriform, and anterior cingulate areas. Labeling following injections in the intermediate and medial bands (IB and MB) was substantially weaker.
Figure 11
Figure 11
Unfolded maps of the neocortical efferents from the medial entorhinal area (MEA). Maps are labeled with the case name, location, band, and layers involved in the injection site (see icon in lower right corner). Voxels in which there was no labeling are black in the figure. Labeling following MEA injections was weak overal, but injections in the lateral band produced the most labeling. The exception was that piriform and insular cortices were most heavily targeted by the medial band. These injections sites involved deep layers or all layers. Thus, the weaker labeling cannot be explained by the laminar location of the injection sites. See list for abbreviations.
Figure 12
Figure 12
Labeling in piriform cortex (PIR) and ventral agranular insular cortex (AIv) following injections in the lateral band of the LEA and MEA. A. Schematic showing the location of the darkfield photomicrographs. PIR is located below the arrow in both B and C. B. Labeled fibers resulting from an LEA injection site in the lateral band (Case 61B) were heaviest in layer I of PIR near the border with AIv. Weaker labeling was observed in layer III. In general, labeled fibers were restricted to dorsal portions of PIR. Labeling in AIv was moderately dense in layers I and III. C. In contrast, lateral band injections of the MEA produced few labeled fibers in PIR or insular cortex. No labeled fibers in PIR or AIv were observed following this tracer injection located in the MEA lateral band (Case 41P). An injection in the medial MEA band did produce weak fiber labeling. Other abbreviations: af, anterior forceps of the corpus callosum; CL, claustrum; EPd, dorsal part of the endopiriform nucleus. Scale bar: 250 microns.
Figure 13
Figure 13
Results of cluster and discriminant function analyses of the regional patterns of labeled terminal fibers arising from anterograde tract tracer injections in the perirhinal (PER), postrhinal (POR), lateral entorhinal (LEA), and medial entorhinal (MEA). A: An unfolded map showing the location of injection sites included in the cluster analysis, color coded by cluster. B: The cluster analysis yielded three clusters. A canonical discriminant analysis of the cluster solution permitted visualization of the relationship of variables to individual cases. Each experimental case is plotted is placed on the graph according to its score on the first two canonical variables and color coded as in A. One cluster was dominated by PER and lateral band LEA sites, one was dominated by POR sites, and one was dominated the MEA and remaining LEA sites. The cortical input variables that distinguished the three clusters at the level of p<0.006 are plotted as vectors from the origin. Input variables with similar coordinates were averaged. Because the direction and relative lengths of the vectors are important, the vector lengths were multiplied by a constant (2) to make them more visible. Other abbreviations: AI; average of AId, AIv, and AIp; GI, average of GU and VISC; ORB, average of ORBl and ORBm; PL/ILA, average of PL and ILA; VIS, average of VISl, VISm, and VISp.
Figure 14
Figure 14
Summary of the cortical efferents of the perirhinal, postrhinal, and entorhinal cortices. The wiring diagram was simplified by combining some regions, yielding a total of 65 projections. The relative strength of projections is indicated by color and width of the connection lines. The heaviest 5% are designate very strong (red), the next 25% are strong (yellow), the next 30% are designated moderate (green), the next 15% are designate weak (blue). The bottom 25% of the projections were omitted from the diagram for simplification. The connections shown in black are adapted from other studies. See list for abbreviations.

Similar articles

Cited by

References

    1. Aggleton JP, Neave N, Nagle S, Hunt PR. A comparison of the effects of anterior thalamic, mamillary body and fornix lesions on reinforced spatial alternation. Behavioual Brain Research. 1995;68:91–101. - PubMed
    1. Agster KL. [doctoral] Providence, RI: Brown University; 2007. Structure and function of the rodent postrhinal cortex: Comparisons to other cortical regions; p. 317.
    1. Arnault P, Roger M. Ventral temporal cortex in the rat: Connections of secondary auditory areas Te2 and Te3. J Comp Neurol. 1990;302:110–123. - PubMed
    1. Beckstead RM. Afferent connections of the entorhinal area in the rat as demonstrated by retrograde cell-labeling with horseradish peroxidase. Brain Res. 1978;152:249–264. - PubMed
    1. Bucci DJ, Burwell RD. Deficits in attentional orienting following damage to the perirhinal or postrhinal cortices. Behav Neurosci. 2004;118(5):1117–1122. - PubMed

Publication types

Substances